Power
Budgets And Loss Budgets
The terms "power
budget" and "loss budget" are often confused.
The power budget
refers to the amount of fiber optic cable plant loss that a datalink
(transmitter to receiver) can tolerate in order to operate properly.
Sometimes the power budget has both a minimum and maximum value, which
means it needs at least a minimum value of loss so that it does not
overload the receiver and a maximum value of loss to ensure the receiver
has sufficient signal to operate properly.
The loss budget
is the amount of loss that a cable plant should have if it is installed
properly. It is calculated by adding the estimated average losses of all
the components used in the cable plant to get the estimated total
end-to-end loss. The loss budget has two uses, 1) during the design stage
it is used to ensure the cabling being designed will work with the links
intended to be used over it and 2) after installation, the loss budget for
the cabling is compared to the actual test results to ensure the cable
plant is installed properly.
Some
standards refer to the loss budget as the "attenuation allowance" but
there seems to be very limited use of that term.
Obviously, the power
budget and loss budget are related. A data link will only operate if the
cable plant loss is within the power budget of the link.
Remember the calculated loss budget is
an estimate that
assumes the values of component losses and does not take into account
the uncertainty of the measurement. Be aware of this because if
measurements are close to the loss budget estimates, some judgement is
needed to not fail good fibers and pass bad ones! This is discussed in
depth in the page on "Installation
Deliverables."
Power
Budget
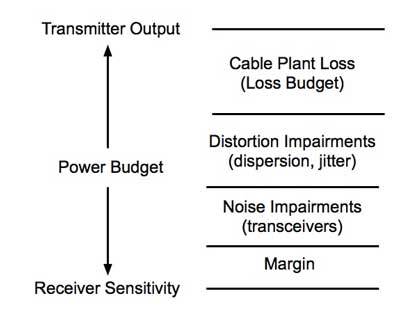
All datalinks are
limited by the power budget of the link. The power budget is the
difference between the output power of the transmitter and the input power
requirements of the receiver, both of which are defined as power coupled
into or out of optical fiber of a type specified by the link. The power
budget is not just a straightforward determinant of the maximum loss in
the cable plant that the link can tolerate. As shown below, cable plant
loss is only a part of the power budget. Distortion impairments, for
example from dispersion (modal and chromatic dispersion in MM fiber,
chromatic and polarization mode dispersion in SM fiber), reduce the power
budget. In multimode gigabit Ethernet networks, for example, transceivers
have a dynamic range (transmitter output to receiver sensitivity) of about
5-6 dB before dispersion is factored in, leaving a power budget of about 2
dB.
Noise in
transceivers, mainly in the receiver, affect the power budget also. The
receiver has an operating range determined by the signal-to-noise ratio
(S/N) in the receiver. The S/N ratio is generally quoted for analog links
while the bit-error-rate (BER) is used for digital links. BER is
practically an inverse function of S/N. Transceivers may also be affected
by the distortion of the transmitted signal as it goes down the fiber, a
big problem with multimode links at high speeds or very long OSP
singlemode links.
When
testing a fiber in a cable plant to determine if the cable plant will
allow a specific link to operate over it, the test should be made from
transceiver to transceiver, e.g. the cable plant with patchcords
installed on either end that would be used to connect the transceivers
to the cable plant. When doing a link loss budget (below) for the
cabling to be used with a given link to determine if the link will
operate over that link, the loss of the patchcords may also be included.
Testing The Power
Budget For A Link
How is the power budget determined? You test the link under operating
conditions and insert loss while watching the data transmission quality.
The test setup is like this:

Connect the transmitter and receiver with patchcords to a variable
attenuator. Increase attenuation until you see the link has a high
bit-error rate (BER for digital links) or poor signal-to-noise ratio
(SNR for analog links). By measuring the output of the transmitter
patchcord (point #1) and the output of the receiver patchcord (point #2),
you can determine the maximum loss of the link and the maximum power
the receiver can tolerate.
From this test you
can generate a graph that looks like this:
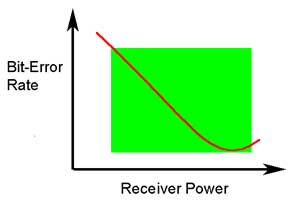
A receiver must have enough power to have a low BER (or high SNR, the
inverse of BER) but not so much it overloads and signal distortion affects
transmission. We show it as a function of receiver power here but knowing
transmitter output, this curve can be translated to loss - you need low
enough loss in the cable plant to have good transmission but with low loss
the receiver may overload, so you add an attenuator at the receiver to get
the loss up to an acceptable level.
You must realize that not all transmitters have the same power output nor
do receivers have the same sensitivity, so you test several (often many)
to get an idea of the variability of the devices. Depending on the point
of view of the manufacturer, you generally error on the conservative side
so that your likelihood of providing a customer with a pair of devices
that do not work is low. It's easier that way.
Furthermore, if your link uses multimode fiber at high bit rates (or
singlemode on long links at very high bit rates), there will be
dispersion. Dispersion spreads out the pulses, causing a power penalty.
That's why high speed Ethernet at 10G has a loss budget of 2dB while the
power budget calculated from transmitter and receiver specifications is
about 6dB.
Calculating
Cable Plant Link Loss Budget
Loss budget analysis
is the calculation of a fiber optic cabling system's estimated loss
performance characteristics. This is sometimes confused with the
communication system "power budget" which is a specification of the
dynamic range of the electronics, the difference between the output power
of the transmitter coupled into the fiber and the minimum received power
required at the receiver for proper data transmission. The communications
system power budget will set a limit for the loss of the cable plant.
The cable plant loss
budget needs to consider transceiver wavelength, fiber type, and link
length plus the losses incurred in splices, connections and other passive
devices like FTTH or OLAN PON splitters. Attenuation and
bandwidth/dispersion are the key parameters for the cable plant loss
budget analysis.
FOA has a online
Loss Budget
Calculator web page that will calculate the loss budget for your
cable plant. This is a good page to bookmark on your smartphone, tablet
and/or laptop to have for making calculations in the field.

FOA has a free app
for iOS smartphones and tablets that will calculate loss budgets for the
cable plant you are designing or testing. See the app store for your
device for details.
Analyze
Link Loss In The Design Stage
Prior to designing
or installing a fiber optic cabling system, a loss budget analysis is
recommended to make certain the system will work over the proposed link.
That same loss budget will be used as to compare test results after
installation of the cabling to ensure that the components were installed
correctly. Both the passive and active components of the circuit have to
be included in the loss budget calculation. Passive loss is made up of
fiber loss, connector loss, and splice loss. Don't forget any couplers or
splitters in the link. Active components are system gain, wavelength,
transmitter power, receiver sensitivity, and dynamic range. Prior to
system turn up, test the circuit with a source and FO power meter to
ensure that it is within the loss budget.
The idea of a loss
budget is to ensure the network equipment will work over the installed
fiber optic link. It is normal to be conservative over the specifications!
Don't use the best possible specs for fiber attenuation or connector loss
- give yourself some margin!
The best way to
illustrate calculating a loss budget is to show how it's done for a
typical 0.2 km multimode link. The link may be analyzed and tested in two
ways, with or without the patchcords that connect the equipment. With the
patchcords, the cable plant has 5 connections (2 connectors at each end to
connect to patchcords connecting to the transmitter and receiver), 3
connections at patch panels in the link) and one splice in the middle. Without
the patchcords, the cable plant has 3 connections (2 connectors at each
end for the transmitter and receiver), 1 connection at a patch panel in
the link) and one splice in the middle.
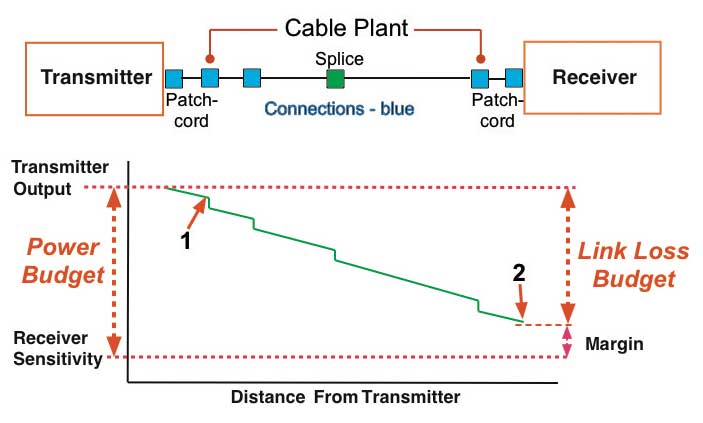
See the drawings
below of the link layout and the instantaneous power in the link at any
point along it's length, scaled exactly to the link drawing above it.
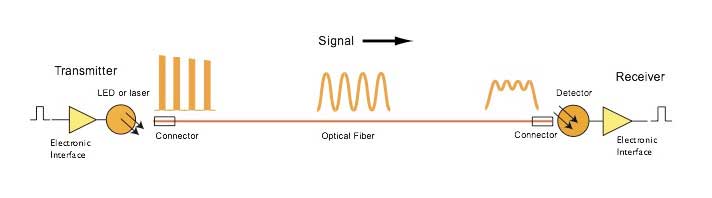
At
the top is a fiber optic link with a transmitter connected to. a cable
plant with a patchcord. The cable plant has 1 intermediate connection
and 1 splice plus, of course, "connectors" on each end which become
"connections" when the transmitter and receiver patchcords (or reference
test cables) are connected. At the receiver end, a patchcord connects
the cable plant to the receiver.
Note: A
connector is the hardware attached to the end of a fiber which allows it
ti be connected to another fiber or a transmitter or receiver. When two
connectors are mated to join two fibers, usually requiring a mating
adapter, it is called a connection. Connectors have no loss; only
connections have loss.
Below
the drawing of the fiber optic link above is a graph of the power in the
link over the length of the link. The vertical scale (Y) is
optical power at the distance from the transmitter shown in the
horizontal (X) scale. As optical signal from the transmitter travels
down the fiber, the fiber attenuation and losses in connections and
splice reduces the power as shown in the green graph of the power.
Note: That
graph above looks like an OTDR trace. The OTDR sends a test pulse down the
fiber and backscatter allows the OTDR to convert that into a snapshot of
what happens to a pulse going down the fiber. The power in the test pulse
is diminished by the attenuation of the fiber and the loss in connectors
and splices. In our drawing, we don't see reflectance peaks but that
additional loss is included in the loss of the connector.
On the left side of the graph, we show the power coupled from the
transmitter into its patchcord, measured at point #1 (the end of the
transmitter patchcord) and the attenuated signal at the end of the
patchcord connected to the receiver shown at point #2. We also show the
receiver sensitivity, the minimum power required for the transmitter and
receiver to send error-free data.
The difference between the transmitter output and the receiver sensitivity
is the power budget. Expressed in dB, the power budget is the
amount of loss the link can tolerate and still work properly - to
send error-free data. The difference between the transmitter
output (point #1) and the receiver power at its input (point #2) is
the actual loss of the cable plant experienced by the fiber optic data
link.
The
difference between the power coupled into the cable plant and the
power at the receiver is the loss of the cable plant. That's what we
estimate when we calculate a loss budget.
It's
also what is called "insertion loss" tested with a test source and
power meter.
Note:
This concept gets many questions - but two are most common. Why do
you include the loss of the connectors on the ends if they are
connected to a transmitter and receiver. And what about testing a
permanently installed cable plant from patch-panel (or wall outlet) to
another patch panel, not including the final patchcords used to
connect equipment.
Why do you include the connectors on each end? Depending on the design
of the transceivers (and especially if they have pigtailed lasers or
detectors), practically every factor in connector loss affects coupling
to a transmitter or receiver as well. Whether these connections are
included in the loss budget should depend on whether the margin for the
link to be use on the cable plant was specified to include these
connectors. As
far as we know almost all system specifications are considering
connection losses at both ends. Unless you know the
system was not specified for loss including the end connectors, include
them in calculations of the loss budget.
Testing is another issue. When
the cable plant is tested, the reference cables will mate with those
end connectors and their loss will be included in the measurements but
the results depends on the
method used to set the "0dB"
reference.
If the "0dB" reference for the insertion loss test was done with only
one reference test cable attached between the light source and power
meter which is the most common way, the connectors on the end of the
cable will be included in the loss so the loss budget should include
both connectors.
Most
tests are specified and done with the one cable reference when the
test equipment is compatible with the connectors.
If
the "0dB" reference for the insertion loss test was done with three
cables, the launch reference cable, a receive reference cable and a
third reference cable between them, a method used for many plug and
jack (male/female) connectors such as MPOs, the loss budget should not
incude the connectors on the end. When making the "0dB" reference with
three cables, two connections are included in setting the reference so
the measured value will be reduced by the value of those two
connections. If the loss budget is calculated without the connectors
on the ends, the value will more closely approximate the test results
with a 3-cable reference. The three cable reference is generally done
with plug/jack or male/female connectors like the MPO or when doing a
"channel" test specified in some standards that includes the
permanently installed cable plant with patchcords attached but
excludes the connectors on each end that attach to transceivers.
While the two-cable reference method is rarely used, it includes only
one connector. Thus you could use the same approach when calculating
loss budgets for this test method.
Whatever test method is presumed, it must be documented when the loss
budget is calculated.
Example:
Cable Plant Passive Component Loss - Calculating a Loss Budget
For this analysis,
we'll use our 0.2 km cable plant above without the patchcords so it has 3
connections and one splice.
Step
1. Fiber loss at the operating wavelength over 200m (0.2 km)
Cable
Length (km)
|
0.2 |
0.2 |
|
|
| Fiber
Type |
Multimode |
|
Singlemode |
|
| Wavelength
(nm) |
850 |
1300 |
1310 |
1550 |
| Fiber
Atten. dB/km |
3
[3.5] |
1
[1.5] |
0.4
[1/0.5] |
0.3
[1/0.5] |
| Total
Fiber Loss |
0.60
[0.7] |
0.20
[0.3] |
|
|
(All specs in
brackets are maximum values per EIA/TIA 568
standard. For singlemode fiber, a higher loss is allowed for
premises applications. )
Step
2. Connection Loss
Multimode
connectors will have losses of 0.2-0.5 dB typically (see note about
"connector" vs. "connection" loss). Singlemode connectors, which are
factory made and fusion spliced on will have losses of 0.1-0.2 dB. Field
terminated singlemode connectors (not recommended) may have losses as
high as 0.5-1.0 dB and unacceptable reflectance.
Let's calculate it
at both typical and worst case values.
Remember that we
include all the components in the complete link, including the connectors
on each end.
| Connector
Loss |
0.3
dB (typical adhesive/polish conn) |
0.75
dB (TIA-568 max acceptable) |
| Total
# of Connectors |
3 |
3 |
| Total
Connector Loss |
0.9
dB |
2.25
dB |
Note:
When people say connector loss, they really mean "connection" loss - the
loss of a mated pair of connectors, expressed in "dB." Thus, testing
connectors requires mating them to reference connectors which must be
high quality connectors themselves to not adversely affect the measured
loss when mated to an unknown connector. This is an important point
often not fully explained. In order to measure the loss of the
connectors you must mate them to a similar, known good, connector. When
a connector being tested is mated to several different connectors, it
may have different losses, because those losses are dependent on the
reference connector it is mated to.
(All connectors are
allowed 0.75 max per EIA/TIA 568 standard,
generally much too high except for array - MPO - connectors.)
Remember that
we include all the components in the complete link, including the
connectors on each end. In our example above, the link includes patchcords
on each end to connect to the electronics. We need to assess the quality
of these connectors, so we include them in the link loss budget and if we
test the link end to end, including the patchcords, these connectors will
be included in the test results when connected to launch and receive
reference cables. On some links, only the permanently installed link, not
including the patchcords, will be tested. Again, we still need to include
the connectors on the end as they will be included when we test insertion
loss with reference test cables on each end.
Step
3. Splice Loss
Multimode splices
are usually made with mechanical splices, although some fusion splicing is
used. The larger core and multiple layers make fusion splicing abut the
same loss as mechanical splicing, but fusion is more reliable in adverse
environments. Figure 0.1-0.5 dB for multimode splices, 0.3 being a good
average for an experienced installer. Fusion splicing of singlemode fiber
will typically have less than 0.05 dB (that's right, less than a tenth of
a dB!)
| Typical
Splice Loss |
0.3
dB |
| Total
# splices |
1 |
| Total
Splice Loss |
0.3
dB |
(All splices are
allowed 0.3 max per EIA/TIA 568 standard)
Step
4. Total Passive System Attenuation
Add the fiber loss,
connector and splice losses to get the link loss.
|
Typical |
TIA
568 Max |
| |
850
nm |
1300
nm |
850
nm |
1300
nm |
| Total
Fiber Loss (dB) |
0.6 |
0.2 |
0.7 |
0.3 |
| Total
Connector Loss (dB) |
0.9 |
0.9 |
2.25 |
2.25 |
| Total
Splice Loss (dB) |
0.3 |
0.3 |
0.3 |
0.3 |
| Other
(dB) |
0 |
0 |
0 |
0 |
| Total
Link Loss (dB) |
1.8
|
1.4
|
3.25 |
2.85 |
Note the big
difference between the typical values and the TIA worst case values. Which
should be used for evaluating the cable plant? If you use typical field
installed connectors of the adhesive/polish type or SOCs - fusion splice
on connectors, the lower/typical values are probably a good choice. If you
use MPO or prepolished splice connectors with mechanical splices, the TIA
values may be closer.
In either case it is
important to realize that these are estimates, just estimates, and some
judgement is required.
Remember these
should be the criteria for testing. Allow +/- 0.2 -0.5 dB for
measurement uncertainty and that becomes your pass/fail criterion.
We can use the FOA
Loss Budget Calculator web page to make the calculations.
We just enter the data into the proper fields. Scroll down and click
"Reset" to clear the data fields.
Try calculating
the loss budget for a 25km OSP singlemode link that has 8 splices and
connectors just at each end. Use the typical losses (scroll down to see
the full list) in the calculator below.
FOA's online Loss
Budget Calculator web page will calculate the loss budget
for your cable plant. This is a good page to bookmark on your
smartphone, tablet and/or laptop to have for making calculations in the
field.
Try some other
cable plants for practice - try 13km singlemode at 1310nm, 4 splices and
connectors only on the ends. Use the typical component loss data below
the calculator or use your own estimates.
Equipment Link
Power Budget Calculation: Link loss budget for network hardware
depends on the dynamic range of the electronics, the difference between
the sensitivity of the receiver and the output of the transmitter into the
fiber. You need some margin for system degradation over time or
environment, so subtract that margin (as much as 3dB) to get the loss
budget for the link.
Step
5. Data From Manufacturer's Specification for Active Components (Typical
100 Mb/s link)
| Operating
Wavelength (nm) |
850 |
| Fiber
Type |
MM |
| Receiver
Sens. (dBm@ required BER) |
-21 |
| Average
Transmitter Output (dBm) |
-13 |
| Dynamic
Range (dB) |
8 |
| Recommended
Excess Margin (dB) |
3 |
Step
6. Power Margin Calculation
| Dynamic
Range (dB) (above) |
8 |
8 |
| Cable
Plant Link Loss (dB) |
1.8
(Typ) |
3.25
(TIA) |
| Link
Loss Margin (dB) |
6.2 |
4.75 |
Note that a link
like this may have dispersion penalties, common for MM links at 1G or
above.
As a general rule,
the Link Loss Margin should be greater than approximately 3 dB to allow
for link degradation over time. Sources in the transmitter may age and
lose power, connectors or splices may degrade or connectors with multiple
matings or may get dirty if opened for rerouting or testing. If cables are
accidentally cut, excess margin will be needed to accommodate splices for
restoration. The 3dB rule, of course, is irrelevant if the power budget is
~2dB like some of the 10G multimode links. Then the need for the best
quality installation is critical!
Related
Topics:
Guidelines On What
Loss To Expect When Testing Fiber Optic Cables For Insertion Loss With
A Meter and Source or OLTS
Table of the cable plant length and loss margins
for most LANs and Links
More detailed information can be found on the FOA
Online Reference Guide.
Return To The FOA Home Page
Return To FOA Tech Topics
(C)
2004-18 The Fiber Optic Association, Inc.