
|
Optical Fiber Testing - Loss and Attenuation Coefficient For optical fiber, testing includes fiber geometry, attenuation and bandwidth. The most fundamental parameter for optical fiber is geometry, since the dimensions of the fiber determine its ability to be spliced and terminated to other fibers. The core diameter, cladding diameter and concentricity are the most important factors on how well one can connect or splice two fibers. Thus manufacturers work very hard to control these parameters, including continuous testing throughout the manufacturing process. While testing diameter and concentricity may sound simple, measurements must be made to submicron precision. The process is complicated by the fact that the material is transparent and the dimensions are small enough to reach the limits of optical measurements. Fiber Types and Typical Specifications
* obsolete designs Attenuation The attenuation of the optical fiber is a result of two factors, absorption and scattering. The absorption is caused by the absorption of the light and conversion to heat by molecules in the glass. Primary absorbers are residual OH+ and dopants used to modify the refractive index of the glass. This absorption occurs at discrete wavelengths, determined by the elements absorbing the light. The OH+ absorption is predominant, and occurs most strongly around 1000 nm, 1400 nm and above1600 nm.  The largest cause of attenuation is scattering.Scattering occurs when light collides with individual atoms in the glass and is anisotrophic. Light that is scattered at angles outside the numerical aperture of the fiber will be absorbed into the cladding or transmitted back toward the source Scattering is also a function of wavelength, proportional to the inverse fourth power of the wavelength of the light. Thus if you double the wavelength of the light, you reduce the scattering losses by 2 to the 4th power or 16 times. Therefore , for long distance transmission, it is advantageous to use the longest practical wavelength for minimal attenuation and maximum distance between repeaters. Together, absorption and scattering produce the attenuation curve for a typical glass optical fiber shown above. Fiber optic systems transmit in the "windows" created between the absorption bands at 850 nm, 1300 nm and 1550 nm, where physics also allows one to fabricate lasers and detectors easily. Plastic fiber has a more limited wavelength band, that limits practical use to 660 nm LED sources. Testing Fiber Attenuation The most accurate way of measuring the fiber attenuation coefficient requires transmitting light of a known wavelength through the fiber and measuring the changes over distance. The conventional method, known as the cutback method, involves coupling fiber to the source and measuring the power out of the far end. The fiber is then cut near the source and power measured again. For more accurate measurements, use mode conditioning on the fiber near the source. Multimode fiber needs careful conditioning with a mandrel wrap or other mode conditioner while singlemode fiber just needs one small loop (~2 inches or 50mm) to ensure the fiber has only one mode. 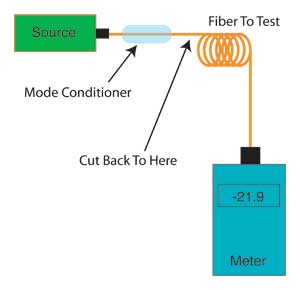 By knowing the power at the source and end of the fiber and the length of the fiber, its attenuation coefficient can be determined by calculating: 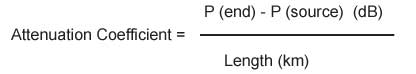 An alternative method of testing fiber, which may be easier in field measurements, involves using a fiber pigtail attached to the source for a launch cable. Then use a temporary mechanical splice on the other end to connect to the fiber to be tested. This is similar to the single-ended loss measurement of terminated cables, but uses the splice instead of connectors at the source end and a bare fiber adapter to connect the fiber to the power meter. This method introduces more uncertainty in the measurement because of the loss of the splice coupled to the fiber under test, since it may not be easy to accurately calibrate the output power of the pigtail. The best method is to use a bare fiber adapter on the power meter to measure the output of the bare fiber, then attach the splice. Alternately, have the splice attached on the pigtail and couple a fiber to the pigtail with the splice and measure the power. Remember that the splice requires a good cleave to get reliable measurements so a good fusion splicer cleaver is recommended. Also it may be necessary to renew the index-matching gel in the splice occasionally or replace the splice if it gets contaminated. 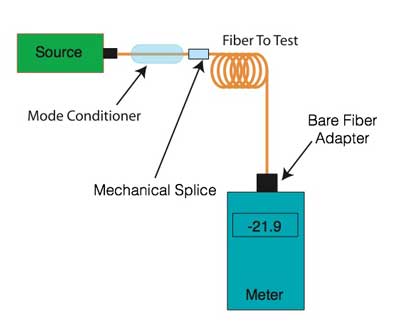
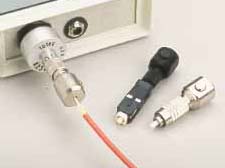 Bare fiber adapters The third method of testing fiber attenuation is to use an OTDR. The OTDR uses an indirect method of measuring loss that involves the backscatter from the fiber. Cables can be attached to the OTDR with a launch cable with a mechanical splice to connect to the fiber under test. 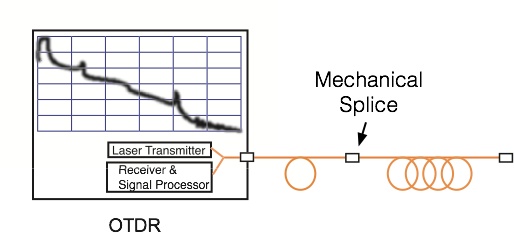 Bare fiber is usually tested with a launch cable with a connector on the OTDR end and bare fiber on the test end, with the bare fiber to be tested connected to the launch cable with a mechanical splice which can be reused or a fusion splice. One needs only take a trace of the fiber and use the loss between two markers a known distance apart to calculate the loss coefficient of the fiber. 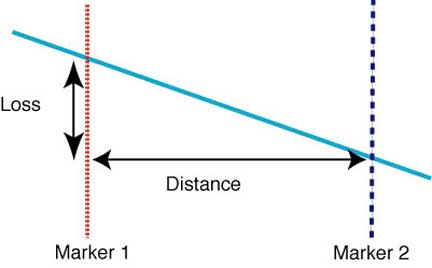 OTDRs generally offer two methods of making this measurement, a simple "two point" method shown here or the "least squares" method which calculates the best fit between the two markers, reducing the effects of noise on the measurement. Test Sources for Loss Measurements On the test source, two factors must be controlled to minimize measurement uncertainty, the spectral output and modal characteristics. The spectral output characteristics obviously include wavelength, as seen in the spectral attenuation curve, but may also include the spectral width. A wide spectral width source suffers absorption over a larger range of wavelengths, making it more difficult to obtain precise data on spectral attenuation at any specific wavelength. Monochromators are used as sources for spectral loss testing, since the spectral width of the source can be controlled exactly. For single wavelength measurements the source can be a fixed wavelength LED or laser. Generally, attenuation measurements will be made with a source appropriate to the fiber. Most multimode fiber systems use LED sources while singlemode fiber systems use laser sources. Thus testing each of these fibers should be done with the appropriate source. Lasers should not be used with multimode fiber, since coherent sources like lasers have high measurement uncertainties in multimode fiber caused by modal noise. The wide spectral width of LEDs sometimes overlap the singlemode fiber cutoff wavelength (the lowest wavelength where the fiber supports only one mode) at lower wavelengths and the 1400 nm OH: absorption band at the upper wavelengths. The additional absorption at either end of the LEDs spectral output may bias the measurements of attenuation on singlemode fiber substantially. Tests from Bellcore showed the effects of sources on measurements of singlemode fiber loss. The LED spectrum covers from the singlemode cutoff wavelength around 1200 nm well into the OH absorption band, while the laser concentrates all its power in an extremely narrow spectral band where the fiber is actually used. Over the range covered by the LED output, the fiber loss varies by 0.2 dB/km, ignoring the OH absorption band. Bellcore tests showed an error of loss caused by the use of the LED of 0.034dB/km. Even with laser sources, the loss varies substantially according to the wavelength of the source. Again Bellcore tests showed a variation of loss of 0.05 dB/km with source variations of 29 nm (1276 and 1305 nm), within the range of typical sources used in the network. So testing should be done with sources as close to the system wavelength as possible, especially with longer links. (Peters, Bellcore reference). Modal Effects on Attenuation (This material is duplicated here) In order to test multimode fiber optic cables accurately and reproducibly, it is necessary to understand modal distribution, mode control and attenuation correction factors. Modal distribution in multimode fiber is very important to measurement reproducibility and accuracy. What is "Modal Distribution" ? In multimode fibers, some light rays travel straight down the axis of the fiber while all the others wiggle or bounce back and forth inside the core. In step index fiber, the off axis rays, called "higher order modes" bounce back and forth from core/cladding boundaries as they are transmitted down the fiber. Since these high order modes travel a longer distance than the axial ray, they are responsible for the dispersion that limits the fiber's bandwidth. In graded index fiber, the reduction of the index of refraction of the core as one approaches the cladding causes the higher order modes to follow a curved path that is longer than the axial ray (the "zero order mode"), but by virtue of the lower index of refraction away from the axis, light speeds up as it approaches the cladding and it takes approximately the same time to travel through the fiber. Thus the "dispersion" or variations in transit time for various modes, is minimized and bandwidth of the fiber is maximized. However, the fact that the higher order modes travel farther in the glass core means that they have a greater likelihood of being scattered or absorbed, the two primary causes of attenuation in optical fibers. Therefore, the higher order modes will have greater attenuation than lower order modes, and a long length of fiber that was fully filled (all modes had the same power level launched into them) will have a lower amount of power in the higher order modes than will a short length of the same fiber. This change in "modal distribution" between long and short fibers can be described as a "transient loss", and can make big differences in the measurements one makes with the fiber. It not only changes the modal distribution, it changes the effective core diameter and numerical aperture also. The term "equilibrium modal distribution" (EMD) is used to describe the modal distribution in a long fiber which has lost the higher order modes. A "long" fiber is one in EMD, while a "short" fiber has all its initially launched higher order modes. What Does Fiber Modal Distribution Look Like ? Modal distribution in a multimode fiber depends on your source, fiber, and the intermediate "components" such as connectors, couplers and switches, all of which affect the modal distribution of fibers they connect. Typical modal distributions for various fiber optic components are shown here. 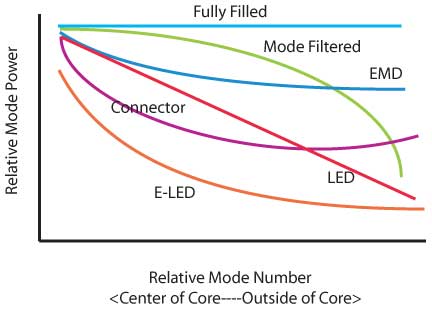 In the laboratory, a lensed optical system can be used to fully fill the fiber modes and a "mode filter", usually a mandrel wrap which stresses the fiber and increases loss for the higher order modes, used to simulate EMD conditions. A "mode scrambler", made by fusion splicing a step index fiber in the graded index fiber near the source can also be used to fill all modes equally. If one has a proper optical system, one can control the launch conditions to very specific levels as desired for the measurements being performed. Relative Modal Distribution of Multimode Fibers: (Right) A fully filled fiber means that all modes carry equal power, as shown by the line across the top of the graph. A long length of fiber loses light in the higher order modes faster, leading to the gently sloping "EMD" curve. Mode filtering strips off the higher order modes, but provides only a crude approximation of EMD. The microlensed LED , often thought to overfill the modes, actually couples most of its power in lower order modes. The E-LED (edge-emitting LED) couples even more strongly in the lower order modes. Connectors are mode mixers, since misalignment losses cause some power in lower order modes to be coupled up to higher order modes. In an actual operating communications system, such controlled conditions obviously do not exist. In fact some work presented by Corning at an EIA Standards meeting shows how far the real world is from what we expected it to be. It has been accepted as "common knowledge" that microlens LEDs (as used with most multimode datacom systems) overfill fibers, and when we use them as test sources, we are testing with an overfilled launch. Not so. Tests on microlens LEDs indicate that they underfill compared to EMD. And edge-emitter LEDs (E-LED), typical of the high speed emitters at 1300 nm, concentrate their power even more into the lower order modes. Other facts that come out of the Corning project shows that connectors mix some power back into the higher order modes due to angular misalignment and switches strip out higher modes . In a simulated FDDI system using 8 fiber optic switches and 20 pairs of connectors, with fiber lengths of 10 to 50 meters between them, the majority of system power was concentrated in the lower order modes. What conclusions can we draw ? The most significant conclusions is that it may not be prudent to design datacom and LAN systems on the worst-case loss specifications for connectors and switches. In actual operation, the simulated system exhibited almost 15 dB less loss than predicted from worst case component specifications (obtained with fully filled launch conditions). In most of today's high speed systems, LEDs are too slow to be used as transmitters, so a special type of low cost 850 nm laser called a VCSEL (vertical cavity surface-emitting laser) is used as a transmitter. VCSELs couple light tightly into the core of a multimode fiber, similar ot a eLED in the diagram above. 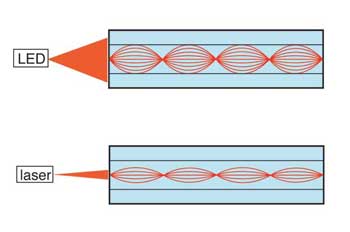 And, when testing cables designed for low speed LED transmitter type systems, using a LED source similar to the one used in the system and short launch cables may provide as accurate a measurement as is possible under more controlled circumstances, since the LED approximates the system source. For newer sytems using VCSEL sources, one should use at least a LED with a mandrel wrap (see below) or a commercially-available mode modifier. The Effect on Measurements If you measure the attenuation of a long fiber in EMD (or any fiber with EMD simulated launch conditions) and compare it to a normal fiber with "overfill launch conditions " (that is the source fills all the modes equally), you will find the difference is about 1 dB/km, and this figure is the "transient loss". Thus, the EMD fiber measurement gives an attenuation that is 1 dB per Km less than the overfill conditions. Fiber manufacturers use the EMD type of measurement for fiber because it is more reproducible and is representative of the losses to be expected in long lengths of fiber. But with connectors, the EMD measurement can give overly optimistic results, since it effectively represents a situation where one launches from a smaller diameter fiber of lower NA than the receive fiber, an ideal situation for low connector loss. The difference in connector loss caused by modal launch conditions can be dramatic. Using the same pair of biconic or SMA connectors, it is possible to measure 0.6 to 0.9 dB with a fully filled launch and 0.3 to 0.4 dB with a EMD simulated launch. Which is a valid number to use for this connector pair's loss ? That depends on the application. If you are connecting two fibers near a LED source, the higher value may be more representative, since the launch cable is so short. But if you are connecting to a cable one km away, the lower value may be more valid. Mode Conditioners
These devices are used to condition modal fill in multimode fiber to reduce measurement uncertainty in testing loss or bandwidth. More information on loss testing Accuracy. More information on mode conditioning for multimode fibers and measurement methods including encircled flux. Cladding Mode Strippers Cladding mode strippers are used to remove any light being propagated in the cladding to insure that measurements include only the effects of the core. Most American fibers are "self-stripping"; the buffer is chosen to have an index of refraction that will promote the leakage of light from the cladding to the buffer. If you are using at least 1 meter of fiber, cladding modes will probably not be a factor in measurements. One can easily tell if cladding modes are a factor. Start with 10 meters of fiber coupled to a source and measure the power transmitted through it. Cut back to 5 meters and then 4, 3, 2, and 1 meter, measuring the power at every cutback. The loss in the fiber core is very small in 10 meters, about 0.03 - 0.06 dB. But if the power measured increases rapidly, the additional light measured is cladding light, which has a very high attenuation, and a cladding mode stripper is recommended for accurate measurements if short lengths of fiber must be used. 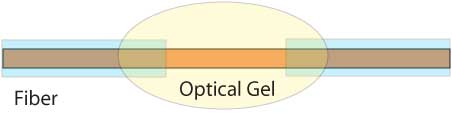 To make a cladding mode stripper, strip off the fiber's buffer for 2 to 3 inches (50 to 75 mm) and immerse the fiber in a substance of equal or higher index of refraction than the cladding. This can be done by immersing the fiber in alcohol or mineral oil in a beaker, or by threading the fiber through a common soda straw and filling the straw with index matching epoxy or an optical gel (Note: stripping the buffer away from the end of a fiber is easily done, using a chemical stripper. If the fiber cannot be chemically stripped, like those with Teflon buffers, check with the fiber manufacturer for instructions.) A caution. Do not stress the fiber after the mode stripper, as this will reintroduce cladding modes, negating the effects of the mode stripper. Mode stripping should be done last if mode scrambling and filtering are also done on a fiber under test. Mode Scramblers Mode scrambling is an attempt to equalize the power in all modes, simulating a fully filled launch. This should not be confused with a mode filter which simulates the modal distribution of a fiber in equilibrium modal distribution (EMD). Both may be used together sometimes however, to properly simulate test conditions. 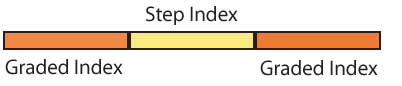 Mode scramblers are easily made by fusion (or mechanical) splicing a short piece of step index fiber in between two pieces of graded index fiber being tested. Simply attaching a step index fiber to a source as a launch cable before a reference launch cable will also work. One can also use methods that produce small perturbations on the fiber, such as running the fiber through a tube of lead shot. But these scramblers are difficult to fabricate and calibrate accurately. In the laboratory, they are usually unnecessary, since accurate launch optics are used to produce fully filled launch conditions. Mode Filters Mode filters are used to selectively remove higher order modes to attempt to simulate EMD conditions, assuming that one starts with fully filled modes. Higher order modes are easily removed by stressing the fiber in a controlled manner, since the higher order modes are more susceptible to bending losses. 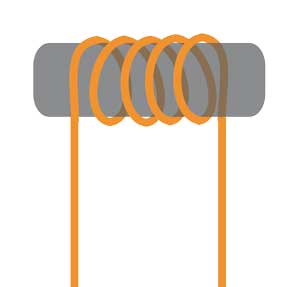 The most popular mode filter is the "mandrel wrap", where the fiber is snugly wrapped around a mandrel several times. The size of the mandrel and the number of turns will determine the effect on the higher order modes. Other mode filters can be made where the fiber is subjected to a series of gentle S bends, either in a form or by wrapping around pins in a plate or by actually using a long length of fiber attached to an overfilling source. 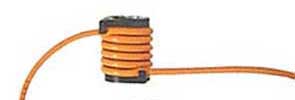 When Do You Use Them ? Obviously, if you are working in the laboratory measuring fiber attenuation using a lamp source and monochrometer, you probably need a combination of all of the above. If you are using a LED or laser source, you might not need any of them, since they greatly underfill the higher order modes. LEDs and lasers also are the same mode fill as actual system sources, providing a proper simulation of actual operating conditions without mode modifiers of any kind. Testing SM Fiber Testing single mode fiber is easy compared to multimode fiber. Singlemode fiber, as the name says, only supports one mode of transmission for wavelengths greater than the cutoff wavelength of the fiber. Thus most problems associated with mode power distribution are no longer a factor. However, it takes a short distance for singlemode fiber to really be singlemode, since several modes may be supported for a short distance after connectors, splices or sources. Singlemode fibers shorter than 10 m may have several modes. To insure short cables have only one mode of propagation, one can use a simple mode filter made from a 30-50mm loop of the cable. Bending Losses Fiber and cable are subject to additional losses as a result of stress. In fact, fiber makes a very good stress sensor. However, this is an additional source of uncertainty when making attenuation measurements. It is mandatory to minimize stress and/or stress changes on the fiber when making measurements. If the fiber or cable is spooled, it will have higher loss when spooled tightly. It may be advisable to unspool it and respool with less tension. Unspooled fiber should be carefully placed on a bench and taped down to prevent movement. Above all, be careful about how connectorized fiber is placed. Dangling fibers that stress the back of the connector will have significant losses. |
|||||||||||||||||||||||||||||||||||||||||||||
|
|