Fiber Optic and Premises Cabling
Project Paperwork - The Project Timeline and Gantt Charts
The key to any successful project is an
understanding of the project, the requirements of the
customer and the expectations of the contractor. These are
spelled out in a number of documents that are created by
and often negotiated amont the parties involved. The
paperwork begins before the project starts so the scope of
work is known to everyone and end only when the final
copies of the documentation are presented to the customer. These are the most common documents, the
Scope of Work (SOW), Request for Proposal (RFP), Request
for Quote (RFQ) and contract, that are used to define a
project. Those documents are covered here. There are additional categories of paperwork we have not
addressed here, e.g. the actual technical design documentation
which includes drawings of the project, lists of
components, installation instructions, etc. which will be
covered in separate web pages.
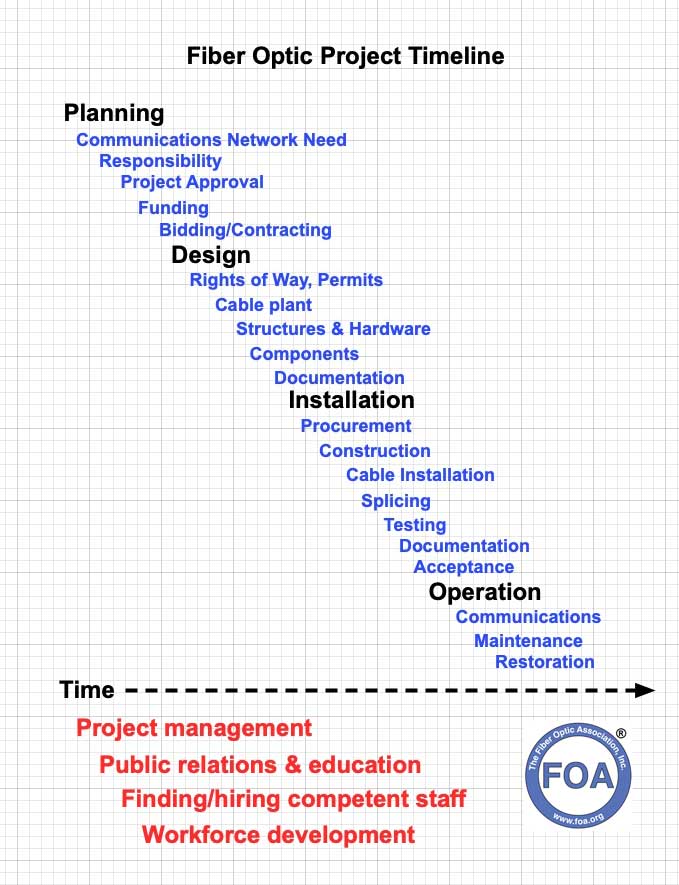
Timeline For A Fiber Optic Project
FOA
has mainly dealt with technical topics regarding fiber optic projects,
but in most of our applications sections like FTTH we also look at
project management. In discussing projects with the owners, it was
helpful to create a timeline for the project, adding topics and
subtopics as they flow in the project itself. The graphic below is a
sample of what we created.
Note: The timeline is not to scale. Parts of the project can take days or weeks, others may take years!
A
fiber optic project can be broken down into stages - planning, design,
installation and operation - with various subtopics like the ones shown
below. These stages operate in overlapping time frames and will have
different timing depending on the size and complexity of the project
plus a number of issues that can occur at various stages.
The projects sections in blue are part of the design and building of the
project. The ones below in red are not directly associated with
building the project, but are important because they include getting the
project approved, financed and finding workers to build it. For now,
let's focus on the blue ones.
The Gantt Chart (With An Excel File To Make Your Own)
The most common way to track projects is the Gantt Chart, a
chart of activities that tracks the progress of projects along a
timeline. Each activity is represented by a bar and the position and
length of the bar represents the starting date and duration of the
activity. This allows you to see what activities are needed for the
project, when the activities start and end so it can be used to track
the progress of the project visually. Here is what a Gantt Chart for a
fiber project might look like:
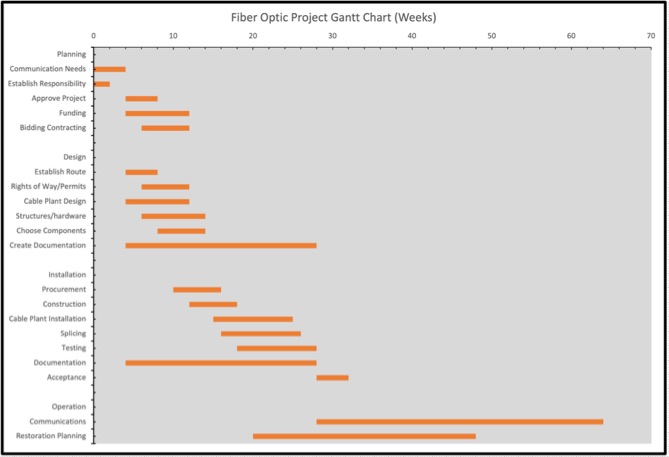
The Gantt Chart above is simply this list converted to a Gantt Chart
using a Microsoft Excel spreadsheet.
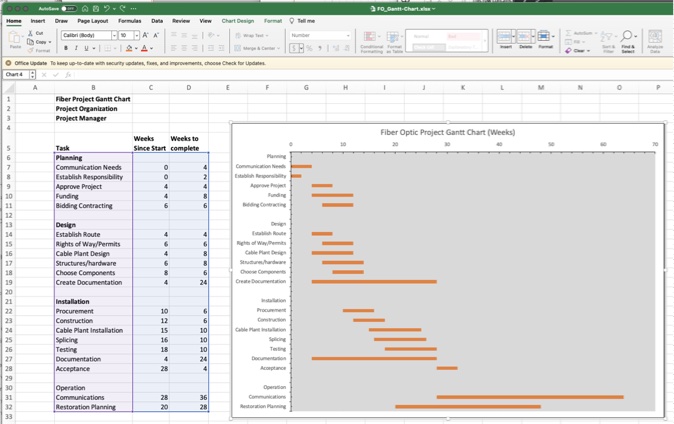
You can download a copy of the FOA Gantt Chart spreadsheet (xlsx file - 16kB)
and use it to create your own Gantt Chart for any project. All you have
to do is to input your own data and change the activity names as
necessary. You can also follow the directions from Microsoft to create your own version.
More Topics On Fiber
Optic Installation
Table of Contents: The FOA
Reference Guide To Fiber Optics
|