Optical Power
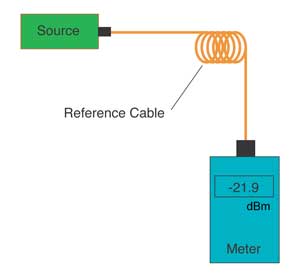
The most basic fiber optic measurement is optical power
from the end of a fiber. This measurement is the basis for
loss measurements as well as the power from a source or
presented at a receiver. Typically both transmitters and
receivers have receptacles for fiber optic connectors, so
measuring the power of a transmitter is done by attaching
a test cable to the source and measuring the power at the
other end. For receivers, one disconnects the cable
attached to the receiver receptacle and measures the
output with the meter.
While optical power meters are the primary power
measurement instrument, optical loss test sets (OLTSs) and
optical time domain reflectometers (OTDRs) also measure
power in testing loss. TIA standard test FOTP-95 covers
the measurement of optical power.
Optical power is based on the heating power of the light,
and some optical lab instruments actually measure the heat
when light is absorbed in a detector. While this may work
for high power lasers, these detectors are not sensitive
enough for the low power levels typical for fiber optic
communication systems (Table 1).
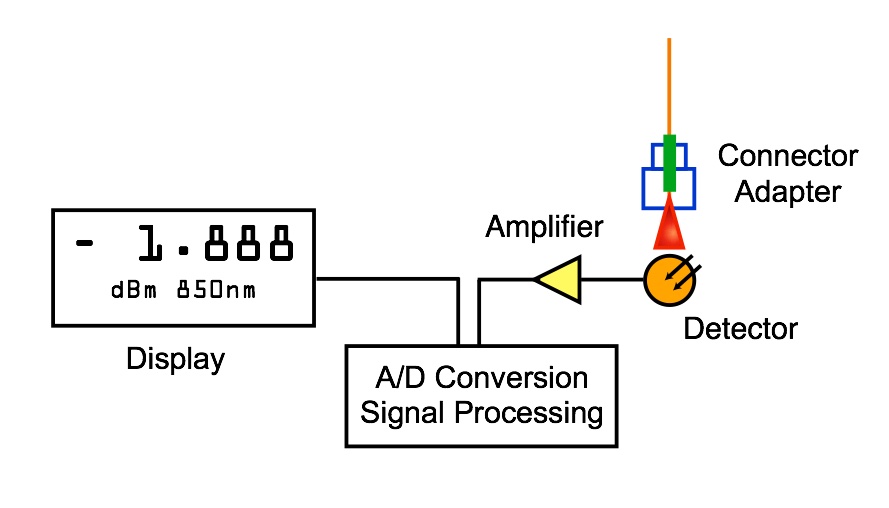
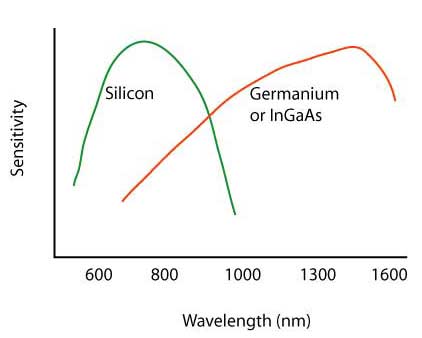
Optical power meters typically use semiconductor detectors
since they are sensitive to light in the wavelengths and
power levels common to fiber optics. Most fiber optic
power meters are available with a choice of 3 different
detectors, silicon (Si), Germanium (Ge), or
Indium-Gallium-Arsenide (InGaAs).
Table 1. Optical power levels typical of fiber optic
communication systems
| Network
Type |
Wavelength,
nm |
Power
Range, dBm |
Power
Range, W |
|
Telecom |
1310, 1550 |
+3 to -45 dBm |
50 nW to 2mW |
|
Datacom |
650, 850, 1300 |
0 to -30 dBm |
1 to 100uW |
|
CATV, DWDM |
1310,1550 |
+20 to -6 dBm |
250 uW to 10mW |
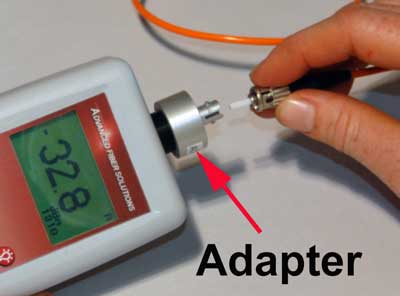
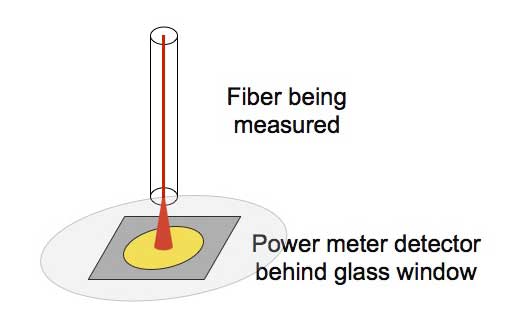
Fiber
optic power meters have inputs for attaching fiber optic
connectors and detectors designed to capture all the light
coming out of the fiber. Power meters generally have
modular adapters that allow connecting to various types of
connectors. This connection is considered a "no loss"
connection. In reality, we do not capture all the light
from the fiber because there is a glass window on the
detector and that window and the detector are slightly
reflective. However the coupling is very consistent and
when we calibrated the meter, we calibrate with a fiber
optic cable under the same conditions. Thus, what we
measure of the light by presenting a connector to the
power meter is both consistent and calibrated as long as
you choose the proper calibration wavelength.
Silicon photodiodes are sensitive to light in the range of
400 to 1000 nm and germanium and indium-gallium-arsenide
photodiodes are sensitive to light in the range of 800 to
1600 nm.
Silicon detectors are very low noise detectors sensitive
to light at approximately 400 to 1100 nm wavelength,
depending on the exact method of fabrication. Thus, they
are useful for standard datacom links using 820 nm LEDs
and glass fiber or 665 nm LEDs and plastic fiber. They can
also be used with older telecom systems that used 850 nm
lasers.
Silicon detectors have inherently low noise, low leakage
currents and therefore very low noise floors when used
with transimpedance amplifiers in power meters. Typical
noise floors on fiber optic instruments using Si detectors
is -70 to -90 dBm, or about 1 to 100 picowatts.
Germanium detectors are sensitive to light in the 800 to
1800 nm wavelength, making them useful for all systems
using glass fiber, including 1300 and 1550 nm single mode
systems. Ge detectors are noisier however, creating a
higher noise floor for low level measurements. This noise
is proportional to detector area, so by using a smaller
detector, one obtains a lower noise floor. However,
smaller detectors require positioning the fiber end very
close to the window of the detector and centered
accurately over the detector sensitive area. The noise of
a 2 mm Ge detector is typically 10 to 50 times lower than
room temperature 5 mm Ge detectors.
Some manufacturers of fiber optic power meters have chosen
to cool these large Ge detectors to reduce the noise and
get lower measurement limits. This leads to more sensitive
measurements but with a penalty of increased circuit
complexity, .instrument weight and short battery life,
since one must provide up to 1 amp current to the
thermoelectric cooler in the Ge detector package.
Another solution for extremely low level measurements at
1300 and 1550 nm is to utilize InGaAs detector technology,
, which has been developed for the receivers of high speed
long wavelength communication systems. InGaAs detectors
have the same sensitivity range as Ge, but are much less
noisy. With InGaAs detectors, measurements can be made to
-65 dBm (less than 0.5 nW) with ease. However, InGaAs
detectors are very expensive, limiting their usage to only
the most expensive instruments.
Table 3.2. Characteristics of detectors used in Fiber
Optic Power Meters
| Detector
Type |
Wavelength
Range (nm) |
Power
Range (dBm) |
Comments |
| Silicon |
400-1100 |
+10 to -70 |
|
| Germanium |
800-1600 |
+10 to -60 |
-70 with small area detectors, +30 with attenuator
windows |
| InGaAs |
800-1600 |
+10 to -70 |
Small area detectors with fiber pigtails often
used |
Measurement Units: "dB"
and "dBm"
Whenever tests are performed on fiber optic networks, the
results are displayed on a meter readout in dB. Optical
loss is measured in dB while optical power is measured
in dBm. Loss is a negative number (like 3.2 dB) as are
most power measurements. Confused? Many fiber optic techs
are too. Lets see if we can clear up some of the
confusion.
When we make fiber optic measurements, we are measuring
the power in the light we measure. The standards we use
for power measurements, maintained by NIST (the US
National Institute of Standards and Technology,) are
actually determined by the heating effect of the light as
it is absorbed in a detector. Every fiber optic power
meter sold is calibrated traceable to the NIST standard so
different meters should measure the same power, within the
limits of calibration uncertainty.
Optical power in fiber optics is similar to the heating
power of a light bulb, just at much lower power levels.
While a light bulb may put out 100 watts, most fiber optic
sources are in the milliwatt to microwatt range (0.001 to
0.000001 watts), so you wont feel the power coming out of
a fiber and its generally not harmful.
In the early days of fiber optics, source output power was
usually measured in milliwatts and loss was measured in dB
or deciBels. Over the years, all measurements migrated to
dB for convenience. This was when the confusion began.
Loss measurements were generally measured in dB since dB
is a ratio of two power levels, one of which is considered
the reference value. The dB is a logarithmic scale
(remember logs from high school math?) where each 10 dB
represents a ratio of 10 times.
The actual equation used to calculate dB is
dB = 10 log (measured power / reference power).
Here is an Excel spreadsheet
that calculates dB/power ratio and dBm/milliwatts.
So 10 dB is a ratio of 10 times (either 10 times as much
or one-tenth as much), 20 dB is a ratio of 100, 30 dB is a
ratio of 1000, etc. When the two optical powers compared
are equal, dB = 0, a result of the log scale used in dB
but a convenient value thats easily remembered.
If we have loss in a fiber optic system, the measured
power is less than the reference power, so the ratio of
measured power to reference power is less than 1 and the
log is negative, making dB a negative number. When we set
the reference value, the meter reads 0 dB because the
reference value we set and the value the meter is
measuring is the same. Then when we measure loss, the
power measured is less, so the meter will read 3.0 dB
for example, if the tested power is half the reference
value. Although meters measure a negative number for loss,
convention has us saying the loss is a positive number, so
we say the loss is 3.0 dB when the meter reads 3.0
dB.
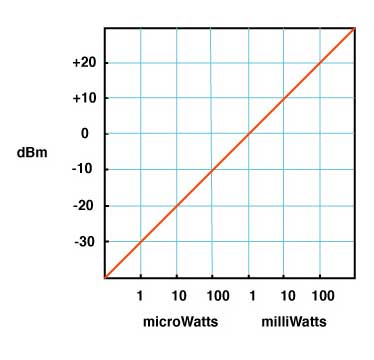
Measurements of optical power are expressed in units of
dBm. The m in dBm refers to the reference power which is
1 milliwatt. Thus a source with a power level of 0 dBm has
a power of 1 milliwatt. Likewise, -10 dBm is 0.1 milliwatt
and +10 dBm is 10 milliwatts.
Instruments that measure in dB can be either optical power
meters or optical loss test sets (OLTS). The optical power
meter usually reads in dBm for power measurements or dB
with respect to a user-set reference value for loss. While
most power meters have ranges of +3 to 50 dBm, most
sources are in the range of 0 to 10 dBm for lasers and
10 to 20 dBm for LEDs. Only lasers used in CATV or
long-haul telephone systems have powers high enough to be
really dangerous, up to +20 dBm thats 100 milliwatts or
a tenth of a watt!
The OLTS or the power meter on the dB scale measures
relative power or loss with respect to the reference level
set by the user. The range they measure will be determined
by the output power of the source in the unit and the
sensitivity of the detector. For multimode fiber, an OLTS
using a LED source will usually measure over a range of
0-30 dB, more than adequate for most multimode cable
plants which are under 10 dB loss. Singlemode networks use
lasers and may have loss ranges of up to 50 dB for
long-haul telecom systems, but campus cabling using
singlemode may only have 1-3 dB loss. Thus a singlemode
OLTS may be different for short and long systems.
If you remember that dB is for measuring loss, dBm is for
measuring power and the more negative a number is, the
higher the loss, its hard to go wrong. Set your zero
before measuring loss and check it occasionally while
making measurements.
Read more about "dB".
Here is an Excel spreadsheet
that calculates dB/power ratio and dBm/milliwatts.
Calibration
Calibrating fiber optic power measurement equipment
requires setting up a reference standard traceable to a
national standards like like the US National Institute of
Standards and Technology (NIST, Boulder, CO) for
comparison purposes while calibrating every power meter or
other instrument. The NIST standard for all power
measurements is an ECPR, or electrically calibrated
pyroelectric radiometer, which measures optical power by
comparing the heating power of the light to the well-known
heating power of a resistor. Calibration is done at 850,
1300 and 1550 nm. Sometimes, 1310 nm is used as the
calibrated wavelength on a power meter, a holdover from
the early 1980s when the telcos and AT&T used 1310 nm
as a standard, but the standard for power meter
calibration is 1300 nm. To conveniently transfer this
measurement to fiber optic power meter manufacturers
calibration laboratories, NIST currently uses a laboratory
optical power meter which is sent around to labs to use as
a transfer standard.
To transfer from this transfer standard to production
instruments, power meter manufacturers use calibrated
detectors or power meters which are regularly checked
against one another to detect any one detector's
variability, and all are periodically recalibrated to
NIST's transfer standards.
In order to transfer the calibration, one needs a source
of known characteristics. Typically laser sources at 850,
1300 and 1550 nm pigtailed to single mode fibers are used
. The laser sources have very narrow spectral width to
allow accurate wavelength calibration, and the single mode
fiber controls the output beam presented to the detector
of the instrument. Each of these sources is checked for
wavelength regularly to insure that no drift has occurred.
The output power of these lasers is precisely controlled
by an optical feedback circuit to insure stability. Even
the temperature of the laser is often controlled precisely
to insure no drift in output power or wavelength occurs
during the calibration process.
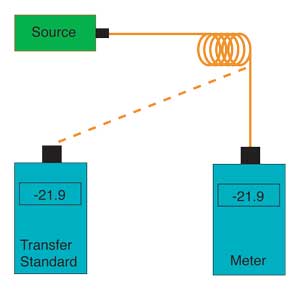
Using the sources described above, one measures the output
of one of the lasers on a transfer standard meter or
detector and record the value. The instrument under test
is then adjusted to read the same value as the transfer
standard detector and a single point calibration is done.
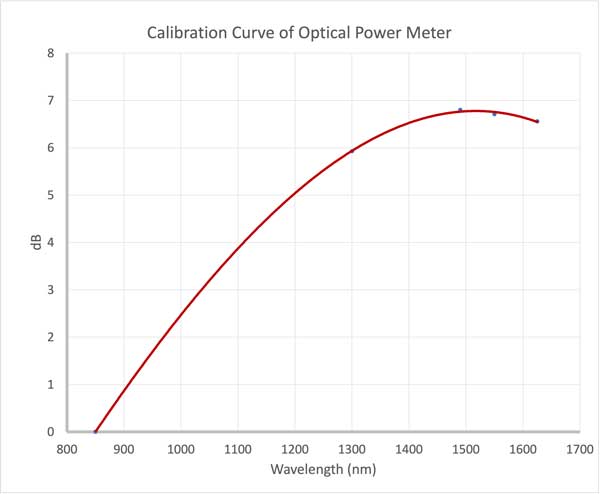
Here is the calibration over wavelength for a commercial
fiber optic power meter.You can see the wavelength
sensitivity of the detector used in the meter. It varies
almost 7dB over the meter's wavelength range.
For all power meters, especially those with autoranging,
one must calibrate on every range, double checking to
insure that the meters have a smooth transition between
ranges to prevent calibration discontinuities. Calibration
is therefore checked at several points near the top and
bottom of the range for every meter.
Meters calibrated in this manner have an uncertainty of
calibration of about +/- 5%, compared to the NIST primary
standards. Limitations in the uncertainty are the inherent
inconsistencies in optical coupling, about 1% at every
transfer, and slight variations in wavelength calibration.
NIST is working continuously with instrument manufacturers
and private calibration labs to try to reduce the
uncertainty of these calibrations.
Recalibration of instruments should be done annually,
however experience has shown that the accuracy of meters
rarely changes significantly during that period, as long
as the electronics of the meter do not fail.
Unfortunately, the calibration of fiber optic power meters
requires considerable investment in capital equipment and
continual updating of the transfer standards, so very few
private calibration labs exist today. Most meters must be
returned to the original manufacturer for calibration.
More on calibration
and metrology
(the science of measurements) in fiber optics.
Understanding FO power
meter measurement uncertainty
Much attention has been paid to developing transfer
standards for fiber optic power measurements. The US NIST
in Boulder, Colorado and standards organizations of most
other countries have worked to provide good standards to
work from. We can now assure traceability for our
calibrations, but even so the errors involved in making
measurements are not ignorable. Understanding those errors
and their probable causes will insure a realistic
viewpoint on fiber optic power measurements.
The first source of error is optical coupling. Light from
the fiber is expanding in a cone. It is important that the
detector to fiber geometry be such that all the light from
the fiber hits the detector, otherwise the measurement
will be lower than the actual value. But every time light
passes through a glass to air interface, such as the
window on the detector, a small amount of the light is
reflected. Some is lost, but some can be re-reflected by
the polished end surface of the connector back into the
detector , the amount dependent on the type of connector
and the quality of its polished surface. And although
detectors have an antireflection coating, some light is
reflected from the detector surface, which can be
re-reflected from the window, connector, etc. Finally, the
cleanliness of the optical surfaces involved can cause
absorption and scattering. The sum total of these
potential errors will be dependent on the connector type,
wavelength, fiber size and NA.
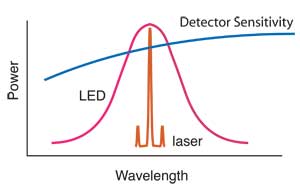
Beyond the coupling errors, one has errors associated with
the wavelength calibration. Semiconductor detectors used
in fiber optic instruments (and systems too) have a
sensitivity that is wavelength dependent. Since the actual
source wavelength is rarely known, there is an error
associated with the spectral sensitivity of the detector.
By industry convention, the three cardinal wavelengths
(850, 1300 and 1550 nm) are used for all power
measurements, not the exact source wavelength. The source
has a finite spectral width, very narrow for lasers, quite
broad for a LED. In order to accurately measure the power
of the source, one needs to know the spectral power
distribution of the actual source being measured, the
sensitivity of the detector and perform a complicated
integration of the two.
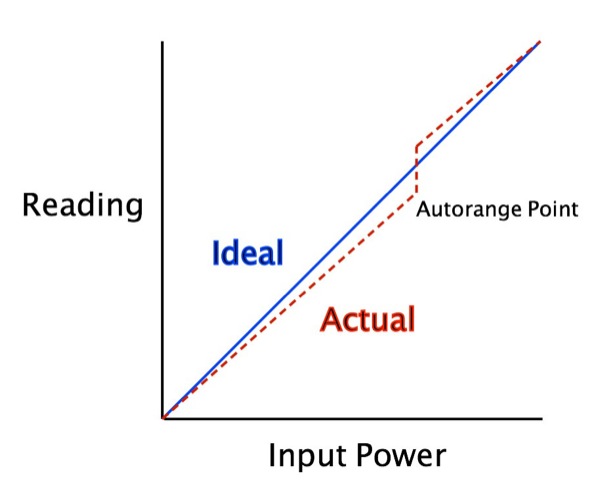
The linearity of the meter can be affected by two issues -
the slope of the calibration curve and the offset where
the meter autoranges. Most meters read power over a large
dynamic range, 1,000,000 to 1 (60dB) is not uncommon, and
that is beyond the range of the electronics in the meter.
To get this kind of range, the meters have a range switch
controlled by the microprocessor that changes the gain in
the amplifier attached to the detector. The amplifiers are
linear and dB is calculated by the microprocessor so it
does not matter if you measure in dB or W and calculate dB
yourself. Calibration of the meter should include looking
at the autoranging points to ensure minimal nonlinearity.
When the meter measures two power levels away from the
autorange point, the error is simply the error in the
calibration slope, which will be proportional to the range
measured. For reading of a few dB, the error is usually
very small, ~0.0x dB. If the measurement includes the
autorange point, the error can be higher, depending on the
amount of error in the autoranging.
This agues for having your meters calibrated by a
factory-approved facility who knows where the autorange
points are and can carefully calibrate around them. If you
just check calibration at low and high points, you may
miss autorange problems.
Another source of error exists for high and low level
measurements. At high levels, the optical power may
overload and saturate the detector, causing the
measurement to be in error on the low side. Consistent
overload may even permanently damage the detector,
especially with small area detectors. This is particularly
a problem with CATV systems, where the transmitter power
is extremely high to get good signal to noise performance
at the receiver. CATV power levels are high enough to
damage the detector in many power meters, especially those
with small area InGaAs detectors. Specialized CATV meters
exist where the detector window has been replaced by a
calibrated attenuator of approximately 20 dB. Thus they
can make measurements at high power levels, up to +20 or
+30 dBm, but sacrifice low level power measurements.
At low levels, the inherent detector noise adds to the
signal and becomes an error. If the signal is 10 dB above
the noise floor (10 time the noise), the offset error is
10% or 0.4 dB. Fotec has always specified the measurement
range of its fiber optic power meters as 10 dB above the
noise floor, but at least one manufacturer specifies it as
only 3 dB, which can cause an error of 50% !
Even when two fiber optic power meters are calibrated
within specifications, the uncertainty may be +/- 5%
(about 0.2 dB) on each meter. A worst case scenario could
have two meters deviating from nominal in opposite
directions, leading to a potential 10% (0.4 dB) error when
measuring the same source and fiber combination. A similar
error can occur in a FOPM when amplifiers autorange,
unless the manufacturer includes a balance adjustment for
calibration of the meter.
When one considers why fiber optic power is measured
(determining source output or receiver power to determine
if a system in within margin or measuring loss), the
impact of errors becomes apparent. But without knowing the
system source spectral output, system detector spectral
sensitivity and the spectral attenuation characteristics
of the fiber, one cannot accurately predict system
performance anyway.
How does one cope with all this uncertainty. On short
systems, design the system with adequate margin. On long
systems, specify system and test source wavelength and
test the cable at that wavelength (or correct for
variations in system sources and test source wavelengths.)
And remember that the error in optical power measurement
may be small to the unknown variations in system
components.
Fiber optic components are sensitive to physical stress
which can induce loss. One can see the effects of physical
movement of fiber optic cables and connectors on fiber
optic assemblies. A simple bend in singlemode fiber cable
can induce several dB loss. All connectors are very
sensitive to forces acting on the cable as it exits the
backshell. Just handling fibers to make measurements can
cause readings to vary by several tenths of dB.
Instrument Resolution vs.
Measurement Uncertainty
Considering the uncertainty of most fiber optic
measurements, instrument manufacturers have provided power
and loss meters with a measurement resolution that is
usually much greater than needed. The uncertainty of
optical power measurements is about 0.2 dB (5%), loss
measurements are more likely to have uncertainties of
0.2-0.5 dB or more, and optical return loss measurements
have a 1 dB uncertainty. Instruments which have readouts
with a resolution of 0.01 dB are generally only
appropriate for laboratory measurements of very low losses
such as connectors or splices under 1 dB or for monitoring
small changes in loss or power over environmental changes
Within the laboratory, a resolution of 0.01 dB can be
extremely useful, since one often measures the loss of
connectors or splices that are under 0.10 dB or changes in
loss under environmental stress that are under 0.1 dB.
Stability of sources and physical stress on cables limits
measurement uncertainty to about 0.02 to 0.05 dB per day,
but 0.01 dB resolution can be helpful in determining small
changes in component performance.
Field instruments are better when the instrument
resolution is limited to 0.1dB, since the readings will be
less likely to be unstable when being read and more
indicative of the measurement uncertainty and especially
important since field personnel are usually not as well
trained in the nuances of measurement uncertainty
Non-Intrusive Power
Measurements
Since one can induce loss in the fiber or cable by bending
it, this lost power can be measured. By using a clip-on
detector, such as used in fiber identifiers or fusion
splicer LID (local injection and detection) systems,
the induced loss can be measured. However, the uncertainty
of the measurement is very high, due to the uncertain
percentage of the power in the fiber that will be coupled
out of the core by the induced stress, the amount of power
that will be transmitted through the buffer of the fiber
(especially with colored buffers) and the jacket of the
fiber. Thus this type of measurement is only used as an
qualitative indicator of systems power presence, not
quantitative measure of system power.
Return to the FOA Guide
Table of Contents
Return to the FOA home
page
|