
| Topic: Modal Effects on Multimode Fiber Loss Measurements | Table
of Contents: The FOA Reference Guide To Fiber Optics |
| Modal Effects on Multimode Fiber Loss Measurements In order to test multimode fiber optic cables accurately and reproducibly, it is necessary to understand modal distribution, mode control and attenuation correction factors. Modal distribution in multimode fiber is very important to measurement reproducibility and accuracy. What is "Modal Distribution" ? In multimode fibers, some light rays travel straight down the axis of the fiber while all the others wiggle or bounce back and forth inside the core. In step index fiber, the off axis rays, called "higher order modes" bounce back and forth from core/cladding boundaries as they are transmitted down the fiber. Since these high order modes travel a longer distance than the axial ray, they are responsible for the dispersion that limits the fiber's bandwidth. In graded index fiber, the reduction of the index of refraction of the core as one approaches the cladding causes the higher order modes to follow a curved path that is longer than the axial ray (the "zero order mode"), but by virtue of the lower index of refraction away from the axis, light speeds up as it approaches the cladding and it takes approximately the same time to travel through the fiber. Thus the "dispersion" or variations in transit time for various modes, is minimized and bandwidth of the fiber is maximized. However, the fact that the higher order modes travel farther in the glass core means that they have a greater likelihood of being scattered or absorbed, the two primary causes of attenuation in optical fibers. Therefore, the higher order modes will have greater attenuation than lower order modes, and a long length of fiber that was fully filled (all modes had the same power level launched into them) will have a lower amount of power in the higher order modes than will a short length of the same fiber. This change in "modal distribution" between long and short fibers can be described as a "transient loss", and can make big differences in the measurements one makes with the fiber. It not only changes the modal distribution, it changes the effective core diameter and numerical aperture also. The term "equilibrium modal distribution" (EMD) is used to describe the modal distribution in a long fiber which has lost the higher order modes. A "long" fiber is one in EMD, while a "short" fiber has all its initially launched higher order modes. What Does Fiber Modal Distribution Look Like ? 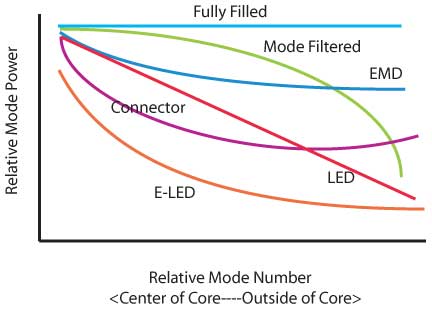 Relative Modal Distribution of Multimode Fibers Modal distribution in a multimode fiber depends on your source, fiber, and the intermediate "components" such as connectors, couplers and switches, all of which affect the modal distribution of fibers they connect. Typical modal distributions for various fiber optic components are shown here. In the laboratory, a lensed optical system can be used to fully fill the fiber modes and a "mode filter", usually a mandrel wrap which stresses the fiber and increases loss for the higher order modes, used to simulate EMD conditions. A "mode scrambler", made by fusion splicing a step index fiber in the graded index fiber near the source can also be used to fill all modes equally. If one has a proper optical system, one can control the launch conditions to very specific levels as desired for the measurements being performed. A fully filled fiber means that all modes carry equal power, as shown by the line across the top of the graph. A long length of fiber loses light in the higher order modes faster, leading to the gently sloping "EMD" curve. Mode filtering strips off the higher order modes, but provides only a crude approximation of EMD. The microlensed LED , often thought to overfill the modes, actually couples most of its power in lower order modes. The E-LED (edge-emitting LED) couples even more strongly in the lower order modes. Connectors are mode mixers, since misalignment losses cause some power in lower order modes to be coupled up to higher order modes. Measuring Modal Fill In MM Fibers Modal fill can be measured by either a nearfield scan or a far field scan. The technique is similar to measuring numerical aperture (NA) by looking at the light exiting the fiber. If light fills more modes the scan (intensity vs. position across the fiber end, either near or far field) will be wider, as shown by the red and green modes and profiles below. The presentation of the data is where changes have occured over the years. Mode power distribution has been used for years but has been replaced by encircled flux for standards. CPR has also been used as a simple metric but has serious problems and is becoming obsolete. 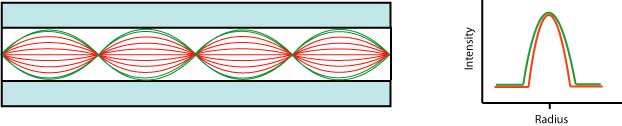 Mode Power Distribution Mode power distribution (MPD) has been used for a long time as a metric for modal distribution. It is a result of a far field scan of the output of a fiber with some mathematical manipulation to show the power in the modes, all normalized, as shown in the graph below. The dark lines are the limits set for test sources. Needless to say, it's not a very easy function to visualize, leading to searches for other ways to measure and define modal distribution. 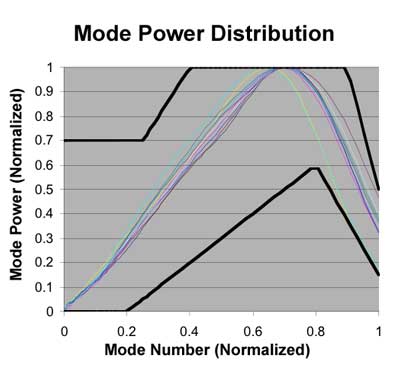 Coupled Power Ratio Coupled power ratio is an easier metric to understand, as it is simply the difference in dB of the power coupled from a fiber under test to both a similar MM fiber and a SM fiber. The rationale is the measurement is the difference between the total power in the fiber and the power in the central modes, so a fully filled fiber will have a greater dB difference in CPR. What often gets ignored when measuring CPR is at 850 nm, the SM fiber must be a 850 SM fiber with a core diameter of ~5 µm which is not a common fiber - not a regular 1300 nm SM fiber. 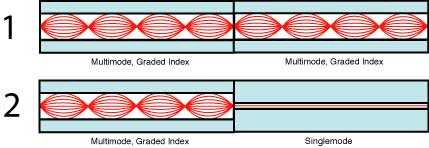 CPR was divided into classes. The rated category values in dB for both 850nm and 1300nm into a 62.5/125 multimode fiber, are as follows: 850nm: Category 1 (overfilled) 25-29 dB Category 2 21-24.9 dB Category 3 14-20.9 dB Category 4 7-13.9 dB (similar to typical VCSELs) Category 5 (very under filled) 0-6.9 dB 1300nm : Category 1 (overfilled) 21-25 dB Category 2 17-20.9 dB Category 3 12-16.9 dB Category 4 7-11.9 dB Category 5 (very under filled) 0-6.9 dB In use a overfilled (Category 1) source with a mandrel wrap was specified for testing (see below). CPR was used for almost 20 years until it was realized that it was subject to large errors in fibers which had central dips in the index profile, a common fault in poorly made fibers. It was determined that a better metric would be a profile created by an integral of the light included inside a given radius of the fiber, leading to the defining of encircled flux. Encircled Flux Recently, a more precise method of defining mode fill has been adopted. Encircled flux (EF), defines the integral of power output of the fiber over the radius of the fiber. When you look look at the graph below, consider that the vertical axis is the total amount of optical power from the source coupled into a fiber core inside the radius shown in the horizontal axis. EF was defined during the development of 10 GB Ethernet as a way to define the light output from an ideal VCSEL source which concentrates more of its power in the center of the fiber than a LED. The EF definition was used for bandwidth simulation only at that point. Of course a real VCSEL may be (is likely to be) different, but this model allowed calculating the bandwidth of this ideal VCSEL in various types of fibers of various lengths to determine their capability of supporting 10 GBE. It was later decided that EF would be a better way to define mode fill for loss testing. This method of measuring mode fill should be more precise than other methods like CPR. EF should be easier to measure using imaging devices that can be calibrated. 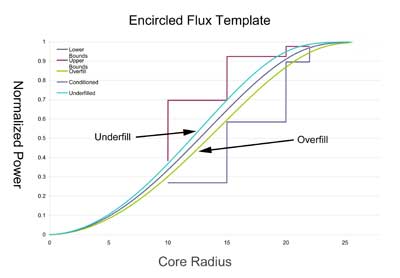 EF is a more sensitive way of defining power and it can be measured using imaging techniques. The vertical (Y) scale shows the total power from the core of the fiber up to a point on the radius (in microns), so when one gets to 25 microns, one measures all the power. The shape of the curve is chosen to emulate an idealized source that is between underfill and overfill conditions. EF has become part of several new MM testing standards. It is intended to create a more reproducible modal condition for testing that is similar to the CPR/mandrel wrap method described below. However, data shows a close correlation between EF and the results of a mandrel wrap conditioner. More on encircled flux. Real World Sources In an actual operating communications system, such controlled conditions obviously do not exist. It has been accepted as "common knowledge" that microlens LEDs (as used with most multimode datacom systems) overfill fibers, and when we use them as test sources, we are testing with an overfilled launch. That is not necessarily so. Tests on microlens LEDs indicate that they may underfill compared to EMD. And edge-emitter LEDs (E-LED), typical of the high speed emitters at 1300 nm, concentrate their power even more into the lower order modes. VCSELs also underfill fibers. Production variations of all LEDs, VCSELs and lasers mean that actual mode fills can vary widely, especially since some devices emit off axis and are carried in skew modes, creating an uneven mode fill. Other results show that connectors mix some power back into the higher order modes due to angular misalignment and switches strip out higher modes . In a simulated FDDI system using 8 fiber optic switches and 20 pairs of connectors, with fiber lengths of 10 to 50 meters between them, the majority of system power was concentrated in the lower order modes. What conclusions can we draw ? The most significant conclusions is that it may not be prudent to design datacom and LAN systems on the worst-case loss specifications for connectors and switches. In actual operation, the simulated system exhibited almost 15 dB less loss than predicted from worst case component specifications (obtained with fully filled launch conditions). In most of today's high speed systems, LEDs are too slow to be used as transmitters, so a special type of low cost 850 nm laser called a VCSEL (vertical cavity surface-emitting laser) is used as a transmitter. VCSELs couple light tightly into the core of a multimode fiber, similar ot a eLED in the diagram above. 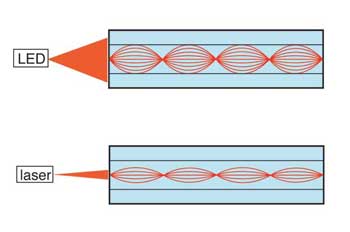 And, when testing cables designed for low speed LED transmitter type systems, using a LED source similar to the one used in the system and short launch cables may provide as accurate a measurement as is possible under more controlled circumstances, since the LED approximates the system source. For newer sytems using VCSEL sources, one should use at least a LED with a mandrel wrap (see below) or a commercially-available mode modifier. Bandwidth also can vary widely with mode fill. Modal bandwidth in MM fibers is highly sensitive to the higher order modes which have the highest dispersion and are harder to control. Most fibers are tested for bandwidth with an overfill condition, but laser-optimized fibers are more appropriately tested with a EF fill which was designed to approximate a VCSEL. The Effect on Measurements If you measure the attenuation of a long fiber in EMD (or any fiber with EMD simulated launch conditions) and compare it to a normal fiber with "overfill launch conditions " (that is the source fills all the modes equally), you will find the difference is about 1 dB/km, and this figure is the "transient loss". Thus, the EMD fiber measurement gives an attenuation that is 1 dB/km less than the overfill conditions. Fiber manufacturers use the EMD type of measurement for fiber because it is more reproducible and is representative of the losses to be expected in long lengths of fiber. But with connectors, the EMD measurement can give overly optimistic results, since it effectively represents a situation where one launches from a smaller diameter fiber of lower NA than the receive fiber, an ideal situation for low connector loss. The difference in connector loss caused by modal launch conditions can be dramatic. Using the same pair of non-PC (physical contact) connectors, it is possible to measure 0.6 to 0.9 dB with a fully filled launch and 0.3 to 0.4 dB with a EMD simulated launch. PC connectors (ST, SC or LC) will have smaller but measurable differences. Here is a drawing showing testing with a fully filled fiber and one where the higher order modes have been stripped off to simulate the fiber with a typical VCSEL source. 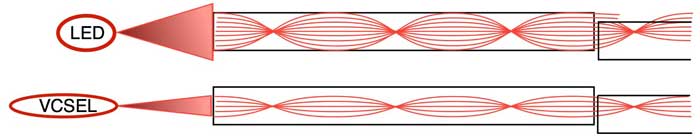 In class, the instructors had each made at least one good connector in our termination lab (we were using the most basic technique, heat-cured epoxy and polishing) so we decided to test their connectors with and without a mandrel wrap mode conditioner (described below) to see if it made a difference. 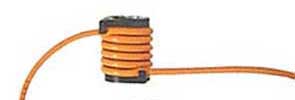 After adding the mandrel wrap to the launch cable, we tested the LED test source using a HOML (higher order mode loss) test as described in the page on EF. With the mandrel wrap, the power was reduced by ~0.6dB, so we left the mandrel on for our testing. Adding the mandrel wrap certainly did make a difference. Connectors tested single-ended without the mandrel wrap at ~0.6dB loss were measured at ~0.2dB with the mandrel wrap. That's how much difference modal conditioning can make on a single connector. Which is a valid number to use for a connector pair's loss ? That depends on the application. If you are connecting two fibers near a LED source, the higher value may be more representative, since the launch cable is so short. But if you are connecting to a cable one km away, the lower value may be more valid. Mode Conditioners In the early days (early-mid 1980s) when even long distance links were 50/125 multimode fiber, the goal was to create modal conditions similar to what one would see in long distance links after equilibrium was established, usually several km from the source. EMD (equilibrium modal distribution) was obtained using a combination of mode scramblers and filters created using stressed fibers and/or a combination of step index and graded index fibers. Other methods were developed for testing premises cabling with LED test sources also, including custom-made step index fibers and using a mandrel wrap mode filter with sources characterized using a simple method called coupled power ratio (CPR) that compares the power of a LED source with multimode and special singlemode (850 nm, 5 micron core) fibers. Another method is it use a gap loss attenuator calibration, with gap loss being one easy way to control mode filtering. Some of these methods have been patented around the world, but its highly doubtful than any of these patents are enforceable due to prior art dating back 30 years. Practice The easiest way to make such a device is to create a simple mode scrambler with a multimode fiber under stress or laid in a tight serpentine followed by a gap loss. The gap can be made with a mechanical splice like a 3M Fiberlok or two connectors with a small washer inside the mating adapter between the two connectors. In theory, one could use a prepolished/splice connector where the gap is added to the internal mechanical splice for the simplest implementation.
These devices are used to condition modal fill in multimode fiber to reduce measurement uncertainty in testing loss or bandwidth. For more information on loss testing, see Accuracy. Cladding Mode Strippers 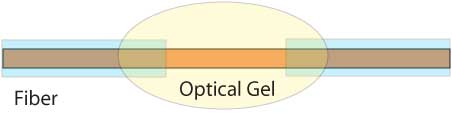 Cladding mode strippers are used to remove any light being propagated in the cladding to insure that measurements include only the effects of the core. Most American fibers are "self-stripping"; the buffer is chosen to have an index of refraction that will promote the leakage of light from the cladding to the buffer. If you are using at least 1 meter of fiber, cladding modes will probably not be a factor in measurements. One can easily tell if cladding modes are a factor. Start with 10 meters of fiber coupled to a source and measure the power transmitted through it. Cut back to 5 meters and then 4, 3, 2, and 1 meter, measuring the power at every cutback. The loss in the fiber core is very small in 10 meters, about 0.03 - 0.06 dB. But if the power measured increases rapidly, the additional light measured is cladding light, which has a very high attenuation, and a cladding mode stripper is recommended for accurate measurements if short lengths of fiber must be used. To make a cladding mode stripper, strip off the fiber's buffer for 2 to 3 inches (50 to 75 mm) and immerse the fiber in a substance of equal or higher index of refraction than the cladding. This can be done by immersing the fiber in alcohol or mineral oil in a beaker, or by threading the fiber through a common soda straw and filling the straw with index matching epoxy or an optical gel (Note: stripping the buffer away from the end of a fiber is easily done, using a chemical stripper. If the fiber cannot be chemically stripped, like those with Teflon buffers, check with the fiber manufacturer for instructions.) A caution. Do not stress the fiber after the mode stripper, as this will reintroduce cladding modes, negating the effects of the mode stripper. Mode stripping should be done last if mode scrambling and filtering are also done on a fiber under test. Mode Scramblers 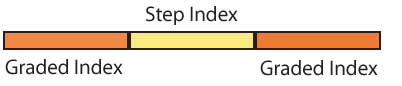 Mode scrambling is an attempt to equalize the power in all modes, simulating a fully filled launch. This should not be confused with a mode filter which simulates the modal distribution of a fiber in equilibrium modal distribution (EMD). Both may be used together sometimes however, to properly simulate test conditions. Mode scramblers are easily made by fusion (or mechanical) splicing a short piece of step index fiber in between two pieces of graded index fiber being tested. Simply attaching a step index fiber to a source as a launch cable before a reference launch cable will also work.  One can also use methods that produce small perturbations on the fiber, such as running the fiber through a tube of lead shot or a fixture that holds the fiber in a serpentine and puts several tight bends in the fiber. But these scramblers are difficult to fabricate and calibrate accurately. In the laboratory, they are usually unnecessary, since accurate launch optics are used to produce fully filled launch conditions. Mode Filters - The "Mandrel Wrap" Mode filters are used to selectively remove higher order modes to attempt to simulate EMD or Encircled Flux conditions with fully an LED source. Higher order modes are easily removed by stressing the fiber in a controlled manner, since the higher order modes are more susceptible to bending losses. The most popular mode filter is the "mandrel wrap", where the fiber is snugly wrapped around a mandrel several times. The size of the mandrel and the number of turns will determine the effect on the higher order modes. Other mode filters can be made where the fiber is subjected to a series of gentle S bends, either in a form or by wrapping around pins in a plate or by actually using a long length of fiber attached to an overfilling source. Below is the mandrel wrap specification from TIA 568, which is to be used with what is basically an overfilled (Category 1 CPR) LED source.
NOTE The mandrel diameters are based on nominal values of 20 mm (0.79 in) and 25 mm (0.98 in)) reduced by the cable diameter and rounded up. The target weights for 50 μm optical fibre at 850 nm have been studied most extensively. The results were very close to the upper limit of the 10 Gb/s Ethernet limit for transmitters, which means that using it would be conservative; i.e. if the cabling passed when tested using this metric then it would be certain to support 10Gb/s Ethernet. The results were very close to an OFL followed by an 18 mm to 20 mm mandrel with five turns. This is close to what had been defined in some standards as the requirement for testing in premises cabling. Thus using the traditional mandrel wrap will closely follow EF guidelines. Checking Mandrel Wrap with HOML - Higher Order Mode Loss 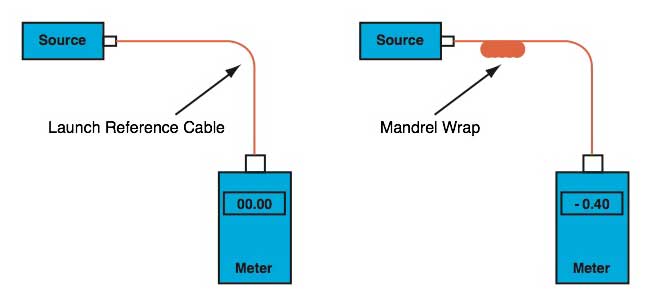 HOML is simple to use. Connect the launch reference cable to a source and measure the output of the reference cable with a power meter. Wrap the launch reference cable around the specified mandrel and measure the output again. If the measured power is reduced by 0.2 to 0.6 dB, the source is essentially EF compliant and ready to use, without the mandrel. Remove the mandrel and make your tests. If the HOML is >0.6dB, leave the mandrel on the reference launch cable and make measurements. If the HOML is <0.2dB, the source has too low a mode fill and should not be used. Following this method using conventional fibers will result in a mode fill similar to EF, the new requirement for MM testing standards. When Do You Use Them ? Obviously, if you are working in the laboratory measuring fiber attenuation using a lamp source and monochrometer, you probably need a combination of all of the above. If you are using a LED or laser source, you might not need any of them, since they greatly underfill the higher order modes. LEDs and lasers also are the same mode fill as actual system sources, providing a proper simulation of actual operating conditions without mode modifiers of any kind. Bend-Insensitive Fibers Bend-insensitive fibers (both MM and SM) have become popular for use as patchcords and running cables inside buildings where tight bends may be needed. BI fiber uses changes in the index profile to reflect leaky modes back into the fibers. BI MM fibers may have more higher order modes and thus more mode fill. They also do not respond to mandrel wrap mode filtering in the same way, generally requiring much tighter bends to achieve the same effect. When using BI MM fibers for launch cables that need modal conditioning, contact the fiber manufacturer for their recommendations, but most fiber manufacturers recommend not using BI fiber as reference launch cables. Testing SM Fiber Testing single mode fiber is easy compared to multimode fiber. Singlemode fiber, as the name says, only supports one mode of transmission for wavelengths greater than the cutoff wavelength of the fiber. Thus most problems associated with mode power distribution are no longer a factor. However, it takes a short distance for singlemode fiber to really be singlemode, since several modes may be supported for a short distance after connectors, splices or sources. Singlemode fibers shorter than 10 m may have several modes. To insure short cables have only one mode of propagation, one can use a simple mode filter made from a 4-6 inch loop of the cable. Return to the FOA Online Reference Guide Table of Contents |
||||||||||||||||||||
|
|