-
Optical Time Domain Reflectometer Trainer
-
- The FOA OTDR Trainer
is a aid to learning how to use an OTDR without owning a real OTDR and
spools of cable. The OTDR Trainer uses software but works just like a
real OTDR. It uses software for OTDRs that are used for analyzing traces
offline. FOA provides traces
that illustrate how the OTDR works and traces of real cable plants to
analyze. The traces are raw data that is analyzed just like a real OTDR.
Before you start using the OTDR Trainer, make sure you have read the FOA Guide page on OTDRs
so you understand the basics of how an OTDR works and makes
measurements. The Trainer will let you use software to view and analyze
traces to make measurements from actual traces.
Part 1 Getting Started
Get The Software And Learn To Use It
First you need to set up the software on your device. We recommend using Fiberizer® from VeEx available free from their website https://veexinc.com/products/fiberizer?product=fiberizer®. Fiberizer comes in several versions, Fiberizer Cloud - an online version
that works with any device, Fiberizer Mobile for Android or iOS devices
or Fiberizer Desktop Plus for Windows PCs. You may choose the version
compatible with your device. We recommend Fiberizer Desktop Plus for
instructors using Windows PCs since it runs without need for an Internet connection and is
easy to project for a class. We will use Fiberizer Desktop Plus for our description on using the FOA materials for training but it works with any of the versions.
Be sure to download the appropriate manual - Fiberizer Desktop Plus User Manual - and read it before downloading and installing the software - Fiberizer Desktop Plus Download.
Also download the zip file of FOA OTDR TRACES which we will use as part of the training exercises.
After you download the software, Follow Section 3. GETTING STARTED in
the Fiberizer manual to install the software and set up your language and
distance units.
Get started using the OTDR software. Open the Fiberizer program.
We've noted some items you need to know to use Fiberizer. We will
note sections in the Fiberizer instruction manual that provide more
details.
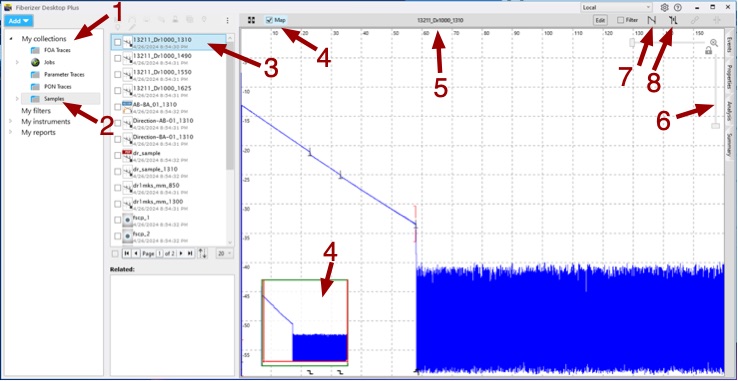
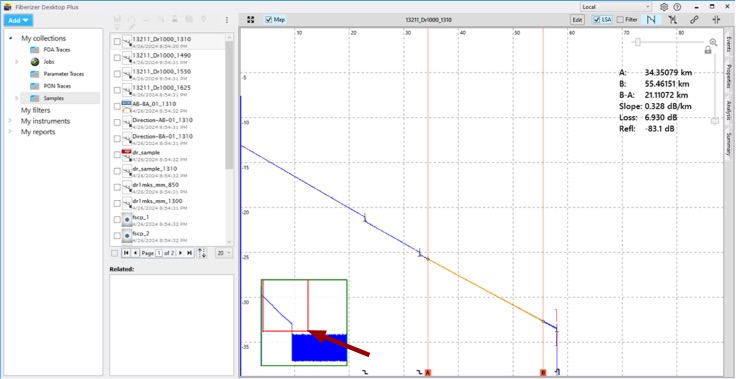
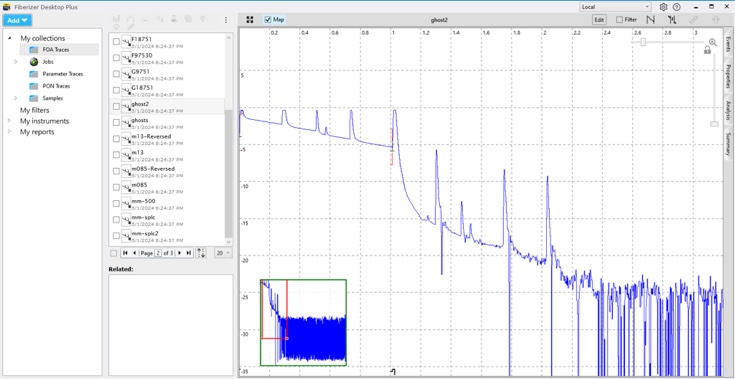
1. The first column shows the folders ("Collections") of files saved. (Sec 5, p 17)
2. This is folder of the samples provided. You will be adding other folders and traces (sor files).
3. This is where you select a trace or traces to display and analyze. (Sec 6, p 26)
4. This is the Map of the trace, At the top, make sure the Map is
selected and the small map is shown below. You can grab the corners of
the red square on the map and use it to zoom in on a section of the
trace.
5. Is the name of the file or files (drop down menu) you are currently viewing.
6. There are vertical and horizontal sliders that also allow you to zoom in on the display.
7. Two point loss measurement (Sec 6.4, p 30)
8. Splice/connector loss measurement. (Sec 6.4, p 30)
The trace is the blue line on the left of the display and the dark
blue segment in the bottom right of the display is the noise of the OTDR
after the end of the fiber.
Viewing and Analyzing Traces (Sec 6.4, p 30)
The Fiberizer software comes with some sample traces to help you get
started, Open one of the sample traces. We chose the first one.
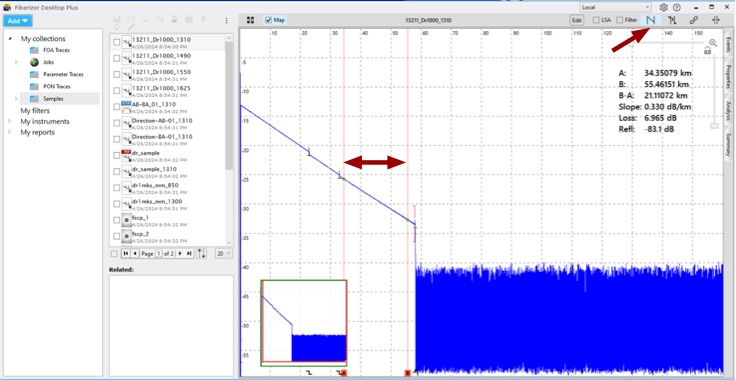
Click on the icon at the top for 2 point loss and markers (red vertical
lines) will appear. Move the markers to either end of a fiber segment to
measure the loss and attenuation coefficient between those two points.
Note the data table that appears in the upper corner that shows the
positions of markers A and B, the distance between them, the loss in dB
and the attenuation coefficient in dB/km.
Sometimes the trace, especially near the far end, can be noisy. That's
when LSA - least squares analysis helps. LSA calculates the best
straight line between the markers and reduced the effects of noise in
the trace.
Click on the LSA icon near the 2 point loss icon. You will see the trace
line between the two markers change color to show the OTDR is using LSA
between those two markers.
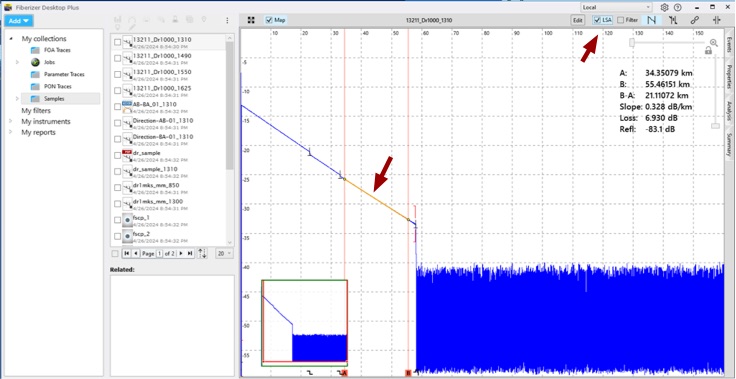
Compare the two measurements. Note there is not much difference here,
but it could make a big difference if the trace had more noise in that
segment.
Grab the corner of the red square in the Map and use it to zoom in on the section of the trace we are analyzing.
Try moving the map square to zoom in on other sections of the trace. Try
the zoom sliders in the upper right corner also. Learn to move around
the trace display and zoom into events of interest.
Next let's make a splice loss measurement. Pick a splice on the trace,
move the markers to each side of it and use the map square to zoom
in on it. You can tell this is a fusion splice because it is
non-reflective. The OTDR measures loss between the markers and displays
it in the data table.
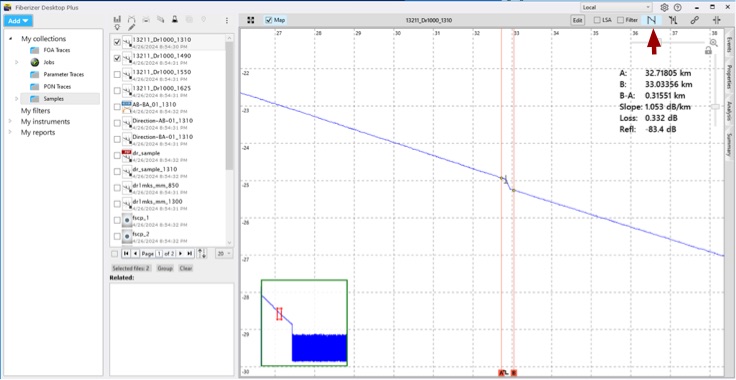
As we describe in the OTDR tutorial, the 2 point measurement includes a
length of fiber between the markers which adds to the splice loss. The
way to correct this is to use the splice loss measurement icon and LSA.
Move the marker to the splice and adjust the LSA positions on either
side of the splice.
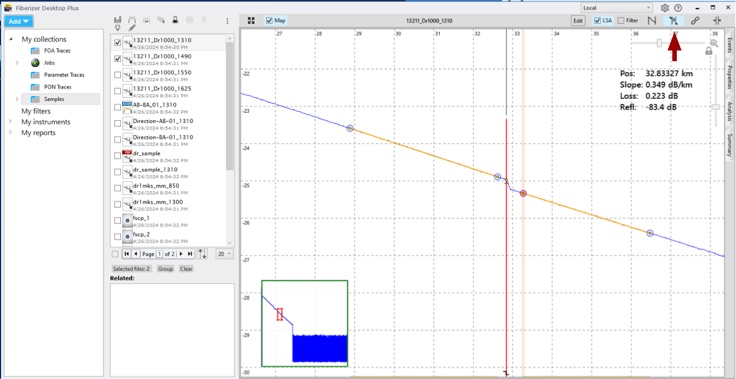
Note the difference in splice loss - 0.332 dB with the 2 point method
and 0.223 dB with the LSA method - the difference of 0.09 dB represents
the loss of the fiber - 0.3 km x 0.3 dB/km. Always better to use LSA
with splice and connector loss.
Automatic Analysis
The software can automatically analyze the trace. (sec 6.2 p 27)
Change the mode by hovering your pointer over the trace file and click
on the pencil icon which appears on the right. Then click on the flask
icon on the upper right corner of the screen. The Analysis thresholds
window will appear. Click on Default and Analyze.
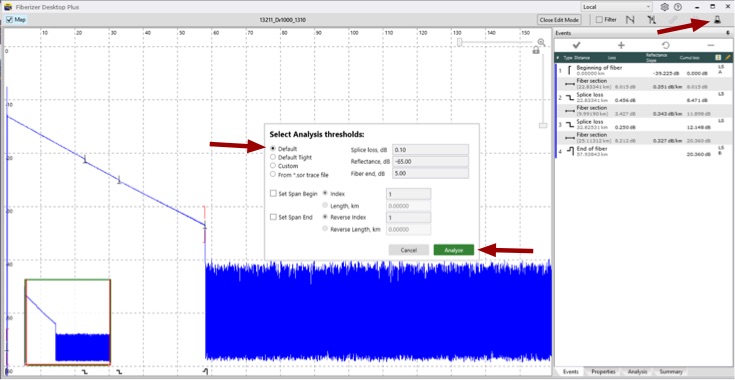
The next screen shows the results of the analysis in
the right of the column. The three arrows below show the splice that we
just measured manually, the display icon for that splice at the bottom
of the screen and the test results on the right column.
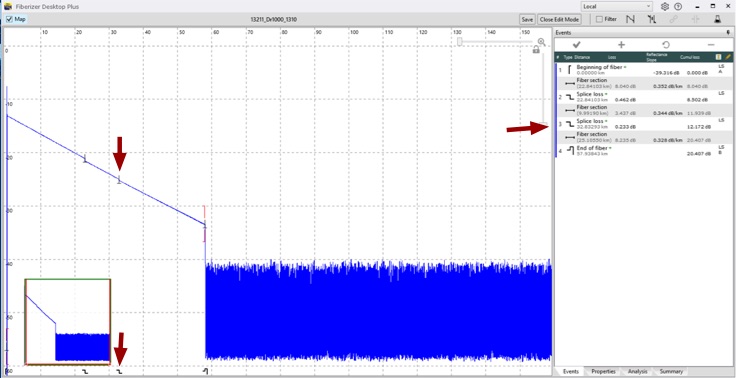
The analysis says the splice loss was 0.250 dB, close to the 0.223 dB of our manual analysis.
That is a quick overview of how the software works to analyze traces.
Choose some other traces to practice on, then we're ready to use this
software for learning more about OTDRs.
Add FOA OTDR Traces To Fiberizer
The FOA traces will be used for teaching about the OTDR, so they need to be loaded into the Fiberizer files.
Download the zip file of FOA OTDR TRACES
which we will use as part of the training exercises.Unzip the file and
you will find 3 folders, Parameter Demo Traces, Traces and FTTx Traces.
Add the files to the Fiberizer traces. (Sec 5.1.1 p17 and Sec 5.2 p22)
Create a new collection: Click on My Collections and Add Collection. Add 3 collections: Parameter Demo Traces, Traces and FTTx Traces
Then click on the collection Parameter Demo Traces to outline it, click on Add and add the files to the collection on Fiberizer. Repeat for the Traces and FTTx Traces files.
Parameter Demo Traces
are 26 traces taken of the same multimode cable plant, with
each of the OTDR parameters changed to allow you to see the effects of
changing these parameters.
(We chose multimode fiber because its higher attenuation makes it easier
to demonstrate some characteristics. There are plenty of singlemode
fibers in the collections also and you can add any sor files you have
yourself.) Traces highlight changes in parameters such as: wavelength,
range,
pulse width, fiber index of refraction, number of averages, and more. Traces and FTTx Traces are traces to analyze.
Comparing Traces
Our first lesson in learning about OTDRs involves understanding how
important setting up the OTDR test parameters is to making good
measurements. Along the way, we'll see some fiber characteristics
demonstrated and lean some new things about fibers. To do this we need
to know how to compare traces.
But first, we need to learn how to compare traces.
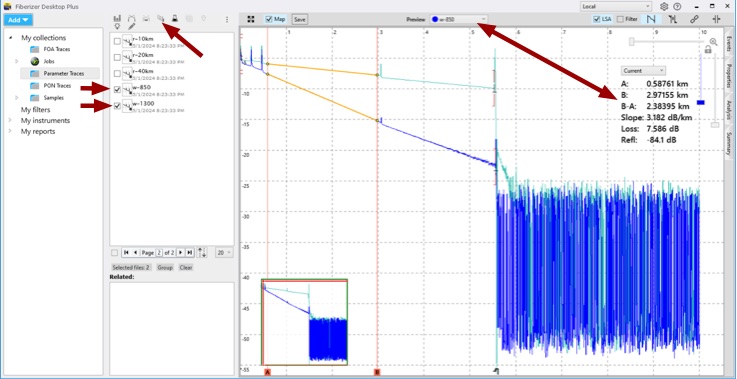
Go to the Parameter Demo Traces collection and click on the boxes in front of traces w-850 and w-1300
to select them for display. Click on the comparison icon above the list
of traces. (It's faint but looks like several traces being compared.)
That will give you a display of both traces. If the traces do not line
up on the left like shown below, you can grab one of the traces and move
it up or down until they align.
The large red arrow shows the drop down menu at the center of the
display that shows the fiber being used for comparison and it's data
table on the right. Choose the other fiber and it will show it's data
table.
You can zoom using the red square, same as with a single trace.
Part 2 - Understanding OTDR Setup - Test Parameters
- One
of the first things to learn about OTDRs is how to set
the options in test parameters. Range, wavelength, pulse width,
averages, etc. all need to be understood so the operator knows what
effect they have on the trace and how to choose the proper setup for a
given test situation. Learning how to interpret traces also requires
having access to large numbers of cables, including some very long ones.
That's not easy in a lab and impossible at home.
Test Wavelength
The attenuation of optical fiber varies over its wavelength range, so
testing at the proper wavelength is important. The OTDR graphically
demonstrates the difference in wavelength as shown in the display above
we used to to show how to compare traces. While you have those two
traces open, visually compare the slopes of the two traces, noting how
the 850nm trace has a slope of over 3 dB/km shown in the data table. Use
the drop down menu at the top center to change to the 1300 nm trace and
see the attenuation of the fiber at 1310 nm. It's much lower. How about
splice or connector loss? Is it sensitive to wavelength? Set up the
loss test on the connection in the middle of the display and test it at
both wavelengths too. Just set up on one wavelength, note the loss in
the data table, then switch to the other trace. How close are the
connection losses at the two wavelengths?
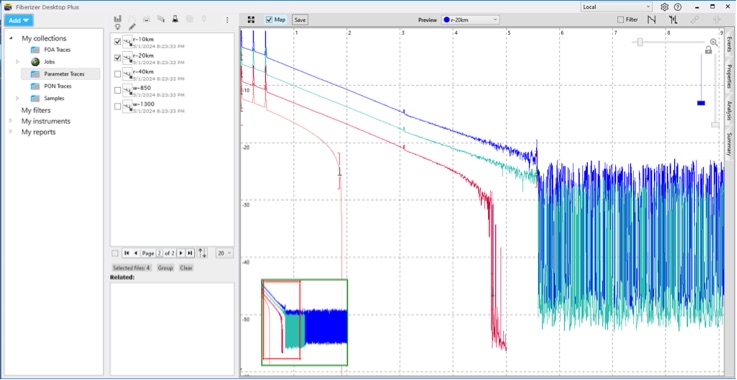
Measurement Range
Some OTDRs require setting the distance range manually. The range should
be set at about twice the length of the cable plant being tested so the
test pulse has time to go to the far end and return. (Remember time is
distance in the OTDR.) If you set the range too short, you may get
traces like the two at the bottom where the distance was set too short.
Averaging and Pulse Width
There are two setup parameters that affect the distance the OTDR can
reach - how long a cable it can test, averaging and pulse width. Here
are three traces showing the effect of averaging.
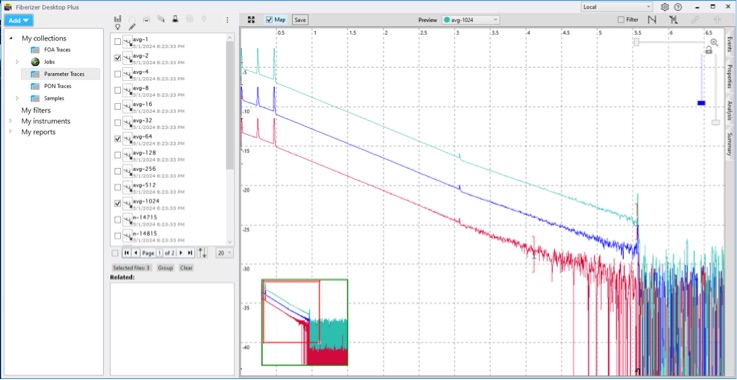
The pulse on the bottom was is the average of two
test pulses sent down the fiber, the next one up was averaged over 64
tests and the top on was averaged 1024 times. Note how averaging reduces
noise and improves the "signal to noise" ratio so you can see
further. The last quarter of the bottom trace is not measurable because
of the noise, averaging 64 times improves the trace so the end can be
measured, but with some uncertainty. The trace that is averaged 1024
times allows making measurements to the end, especially if a LSA
measurement is used. Here is a trade-off - more averages means
longer distance capability and less noise in the trace to affect
measurement uncertainty, but more averages takes more time, making
testing take longer.
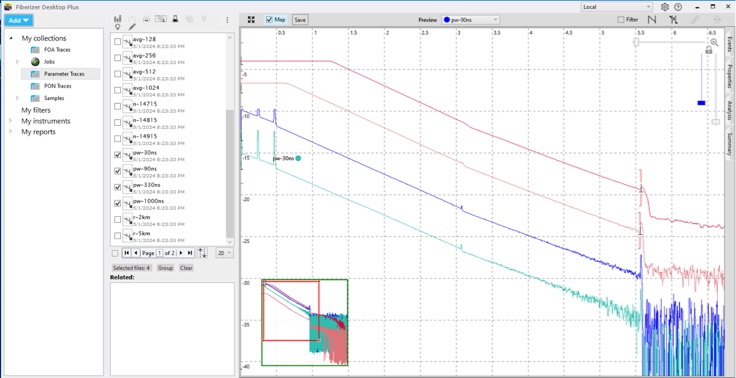
The other way to get more distance capability is
to put more energy into the test pulse by widening it. Widening the
pulse width means there is more energy - more signal - in each pulse. In
the traces below, the lowest trace has the shortest pulse and the least
energy, As you widen the pulse, the energy in the pulse increases,
shown in the rising levels in the display. But there are trade-offs. A
wider pulse has poorer resolution. You can easily see the connection in
the lower pulses, but it becomes harder to see with the wider pulses in
the two top traces. The flat beginning of the two top traces is because
the widest pulses overload the OTDR receiver at short distances,
creating a long dead zone.
Look more closely to the connection in the trace.
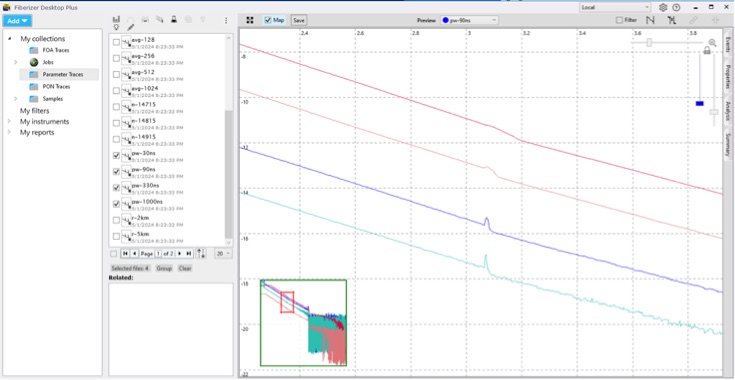
You can see the effects of the pulse width in the traces here, as the lower pulse is the
shortest with the best resolution but has the most noise. As we go to
wider pulses, you get less noise and more range, but less resolution. In
the top trace, we have lots of power, but the events are spread out so
much to be hard to distinguish.
It is a matter of trade-offs. With longer distances, more averages and wider test pulses are often both necessary.
Index Of Refraction
Another parameter that can be set on the OTDR is the index of
refraction of the fiber. The OTDR calculates the length of the fiber
using the time to the even and the speed of light in the fiber.
The speed of light in the fiber is determined by the index of refraction
of the glass which can vary by a few percent. This is the effect of a
change in the index of refraction in the OTDR setup.
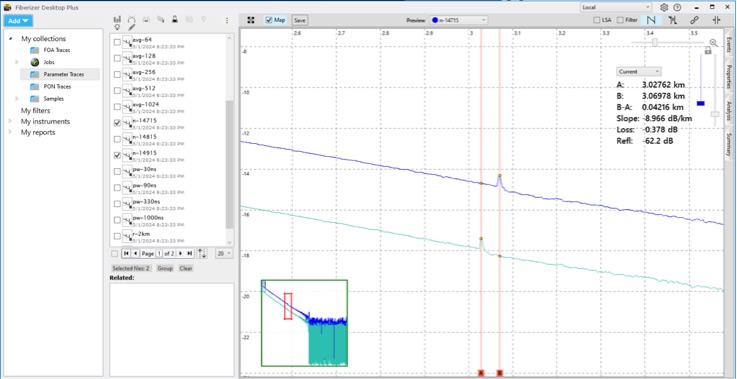
Here we have the same trace taken with an index of
refraction of 1.4715 and 1.4915, within the range of standard fibers.
The connection in the trace is showing a difference in distance of 42
meters (0.04216 km) at only about 3 km away from the OTDR. If you know
the index of refraction of the fiber in the cable you are testing, you
can set that in the OTDR parameters. If you don't know it, don't change
it.
But remember that the OTDR measures fiber length,
not cable length, and the typical cable has about 1% excess fiber length
to prevent stressing the fiber when the cable is pulled. That too adds
uncertainty. Some users suggest calibrating the OTDR for the cable you
are testing - if you know the cable length, you can adjust the index of
refraction so the OTDR reads that cable length, but it's only good for
that cable. The real need to get accurate length measurements is when
trying to locate an underground break, but then you can test from both
ends and compare to the original length to get a better estimate of the
location.
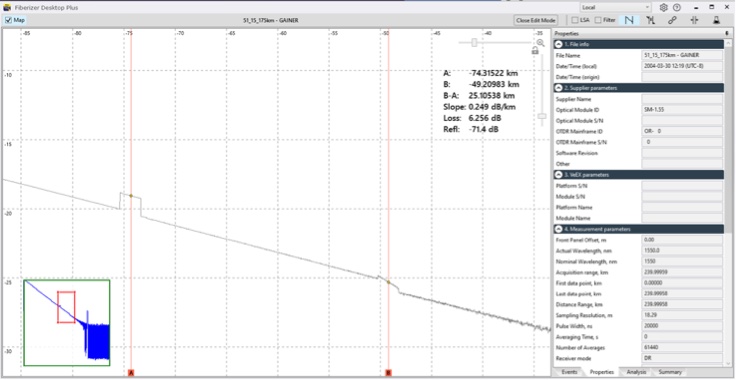
- Real Traces
- Examine traces of real fibers: The
FOA Traces and PON Traces collections have over 40 traces of real cable
plants and 5 traces of FTTH
PON couplers for you to analyze. Few classrooms can offer this many
different traces to analyze - and not many have a 180 km cable run with two gainer sections.
- And watch out for ghosts!
Of course you can add your own traces also. Upload your own collection to analyze.
-
More on OTDRs
Hints
On OTDR Use And Frequently Asked Questions About OTDRs
Can You Fake OTDR Traces?
Coherent OTDRs For Testing Transoceanic Cables
Take the Fiber U
Self-Study Program on OTDRs or the MiniCOurse
on Reading An OTDR Trace at Fiber
U.
See
the FOA Virtual Hands-On OTDR Tutorial
PC Requirements for software:
PC running Windows 11 or Windows 10
Mac running Windows emulator (Boot Camp, Parallels Desktop, etc.)
See the FOA Virtual Hands-On OTDR Tutorial
|